Israeli 4 or more Vehicles in Household

COMPARE

Israeli
Race
Ancestry
AfghanAfricanAlaska NativeAlaskan AthabascanAlbanianAleutAlsatianAmericanApacheArabArapahoArgentineanArmenianAssyrian/Chaldean/SyriacAustralianAustrianBahamianBangladeshiBarbadianBasqueBelgianBelizeanBermudanBhutaneseBlackfeetBolivianBrazilianBritishBritish West IndianBulgarianBurmeseCajunCambodianCanadianCape VerdeanCarpatho RusynCelticCentral AmericanCentral American IndianCherokeeCheyenneChickasawChileanChineseChippewaChoctawColombianColvilleComancheCosta RicanCreeCreekCroatianCrowCubanCypriotCzechCzechoslovakianDanishDelawareDominicanDutchDutch West IndianEastern EuropeanEcuadorianEgyptianEnglishEstonianEthiopianEuropeanFijianFilipinoFinnishFrenchFrench American IndianFrench CanadianGermanGerman RussianGhanaianGreekGuamanian/ChamorroGuatemalanGuyaneseHaitianHmongHonduranHopiHoumaHungarianIcelanderIndian (Asian)IndonesianInupiatIranianIraqiIrishIroquoisIsraeliItalianJamaicanJapaneseJordanianKenyanKiowaKoreanLaotianLatvianLebaneseLiberianLithuanianLumbeeLuxembourgerMacedonianMalaysianMalteseMarshalleseMenomineeMexicanMexican American IndianMongolianMoroccanNative HawaiianNavajoNepaleseNew ZealanderNicaraguanNigerianNorthern EuropeanNorwegianOkinawanOsageOttawaPaiutePakistaniPalestinianPanamanianParaguayanPennsylvania GermanPeruvianPimaPolishPortuguesePotawatomiPuebloPuerto RicanPuget Sound SalishRomanianRussianSalvadoranSamoanScandinavianScotch-IrishScottishSeminoleSenegaleseSerbianShoshoneSierra LeoneanSiouxSlavicSlovakSloveneSomaliSouth AfricanSouth AmericanSouth American IndianSoviet UnionSpaniardSpanishSpanish AmericanSpanish American IndianSri LankanSubsaharan AfricanSudaneseSwedishSwissSyrianTaiwaneseThaiTlingit-HaidaTohono O'OdhamTonganTrinidadian and TobagonianTsimshianTurkishU.S. Virgin IslanderUgandanUkrainianUruguayanUteVenezuelanVietnameseWelshWest IndianYakamaYaquiYugoslavianYumanYup'ikZimbabwean
Immigration
NonimmigrantsImmigrantsAfghanistanAfricaAlbaniaArgentinaArmeniaAsiaAustraliaAustriaBahamasBangladeshBarbadosBelarusBelgiumBelizeBoliviaBosnia and HerzegovinaBrazilBulgariaBurma/MyanmarCabo VerdeCambodiaCameroonCanadaCaribbeanCentral AmericaChileChinaColombiaCongoCosta RicaCroatiaCubaCzechoslovakiaDenmarkDominicaDominican RepublicEastern AfricaEastern AsiaEastern EuropeEcuadorEgyptEl SalvadorEnglandEritreaEthiopiaEuropeFijiFranceGermanyGhanaGreeceGrenadaGuatemalaGuyanaHaitiHondurasHong KongHungaryIndiaIndonesiaIranIraqIrelandIsraelItalyJamaicaJapanJordanKazakhstanKenyaKoreaKuwaitLaosLatin AmericaLatviaLebanonLiberiaLithuaniaMalaysiaMexicoMicronesiaMiddle AfricaMoldovaMoroccoNepalNetherlandsNicaraguaNigeriaNorth AmericaNorth MacedoniaNorthern AfricaNorthern EuropeNorwayOceaniaPakistanPanamaPeruPhilippinesPolandPortugalRomaniaRussiaSaudi ArabiaScotlandSenegalSerbiaSierra LeoneSingaporeSomaliaSouth AfricaSouth AmericaSouth Central AsiaSouth Eastern AsiaSouthern EuropeSpainSri LankaSt. Vincent and the GrenadinesSudanSwedenSwitzerlandSyriaTaiwanThailandTrinidad and TobagoTurkeyUgandaUkraineUruguayUzbekistanVenezuelaVietnamWest IndiesWestern AfricaWestern AsiaWestern EuropeYemenZaireZimbabweAzores
Select to Compare
Race
Ancestry
AfghanAfricanAlaska NativeAlaskan AthabascanAlbanianAleutAlsatianAmericanApacheArabArapahoArgentineanArmenianAssyrian/Chaldean/SyriacAustralianAustrianBahamianBangladeshiBarbadianBasqueBelgianBelizeanBermudanBhutaneseBlackfeetBolivianBrazilianBritishBritish West IndianBulgarianBurmeseCajunCambodianCanadianCape VerdeanCarpatho RusynCelticCentral AmericanCentral American IndianCherokeeCheyenneChickasawChileanChineseChippewaChoctawColombianColvilleComancheCosta RicanCreeCreekCroatianCrowCubanCypriotCzechCzechoslovakianDanishDelawareDominicanDutchDutch West IndianEastern EuropeanEcuadorianEgyptianEnglishEstonianEthiopianEuropeanFijianFilipinoFinnishFrenchFrench American IndianFrench CanadianGermanGerman RussianGhanaianGreekGuamanian/ChamorroGuatemalanGuyaneseHaitianHmongHonduranHopiHoumaHungarianIcelanderIndian (Asian)IndonesianInupiatIranianIraqiIrishIroquoisItalianJamaicanJapaneseJordanianKenyanKiowaKoreanLaotianLatvianLebaneseLiberianLithuanianLumbeeLuxembourgerMacedonianMalaysianMalteseMarshalleseMenomineeMexicanMexican American IndianMongolianMoroccanNative HawaiianNavajoNepaleseNew ZealanderNicaraguanNigerianNorthern EuropeanNorwegianOkinawanOsageOttawaPaiutePakistaniPalestinianPanamanianParaguayanPennsylvania GermanPeruvianPimaPolishPortuguesePotawatomiPuebloPuerto RicanPuget Sound SalishRomanianRussianSalvadoranSamoanScandinavianScotch-IrishScottishSeminoleSenegaleseSerbianShoshoneSierra LeoneanSiouxSlavicSlovakSloveneSomaliSouth AfricanSouth AmericanSouth American IndianSoviet UnionSpaniardSpanishSpanish AmericanSpanish American IndianSri LankanSubsaharan AfricanSudaneseSwedishSwissSyrianTaiwaneseThaiTlingit-HaidaTohono O'OdhamTonganTrinidadian and TobagonianTsimshianTurkishU.S. Virgin IslanderUgandanUkrainianUruguayanUteVenezuelanVietnameseWelshWest IndianYakamaYaquiYugoslavianYumanYup'ikZimbabwean
Immigration
NonimmigrantsImmigrantsAfghanistanAfricaAlbaniaArgentinaArmeniaAsiaAustraliaAustriaBahamasBangladeshBarbadosBelarusBelgiumBelizeBoliviaBosnia and HerzegovinaBrazilBulgariaBurma/MyanmarCabo VerdeCambodiaCameroonCanadaCaribbeanCentral AmericaChileChinaColombiaCongoCosta RicaCroatiaCubaCzechoslovakiaDenmarkDominicaDominican RepublicEastern AfricaEastern AsiaEastern EuropeEcuadorEgyptEl SalvadorEnglandEritreaEthiopiaEuropeFijiFranceGermanyGhanaGreeceGrenadaGuatemalaGuyanaHaitiHondurasHong KongHungaryIndiaIndonesiaIranIraqIrelandIsraelItalyJamaicaJapanJordanKazakhstanKenyaKoreaKuwaitLaosLatin AmericaLatviaLebanonLiberiaLithuaniaMalaysiaMexicoMicronesiaMiddle AfricaMoldovaMoroccoNepalNetherlandsNicaraguaNigeriaNorth AmericaNorth MacedoniaNorthern AfricaNorthern EuropeNorwayOceaniaPakistanPanamaPeruPhilippinesPolandPortugalRomaniaRussiaSaudi ArabiaScotlandSenegalSerbiaSierra LeoneSingaporeSomaliaSouth AfricaSouth AmericaSouth Central AsiaSouth Eastern AsiaSouthern EuropeSpainSri LankaSt. Vincent and the GrenadinesSudanSwedenSwitzerlandSyriaTaiwanThailandTrinidad and TobagoTurkeyUgandaUkraineUruguayUzbekistanVenezuelaVietnamWest IndiesWestern AfricaWestern AsiaWestern EuropeYemenZaireZimbabweAzores
4 or more Vehicles in Household
Income
Poverty
Unemployment
Labor Participation
Family Structure
Vehicle Availability
Education Level
Disability

Israeli 4 or more Vehicles in Household
Tragic

5.2%
4+ VEHICLES AVAILABLE
0.1/ 100
METRIC RATING
296th/ 347
METRIC RANK

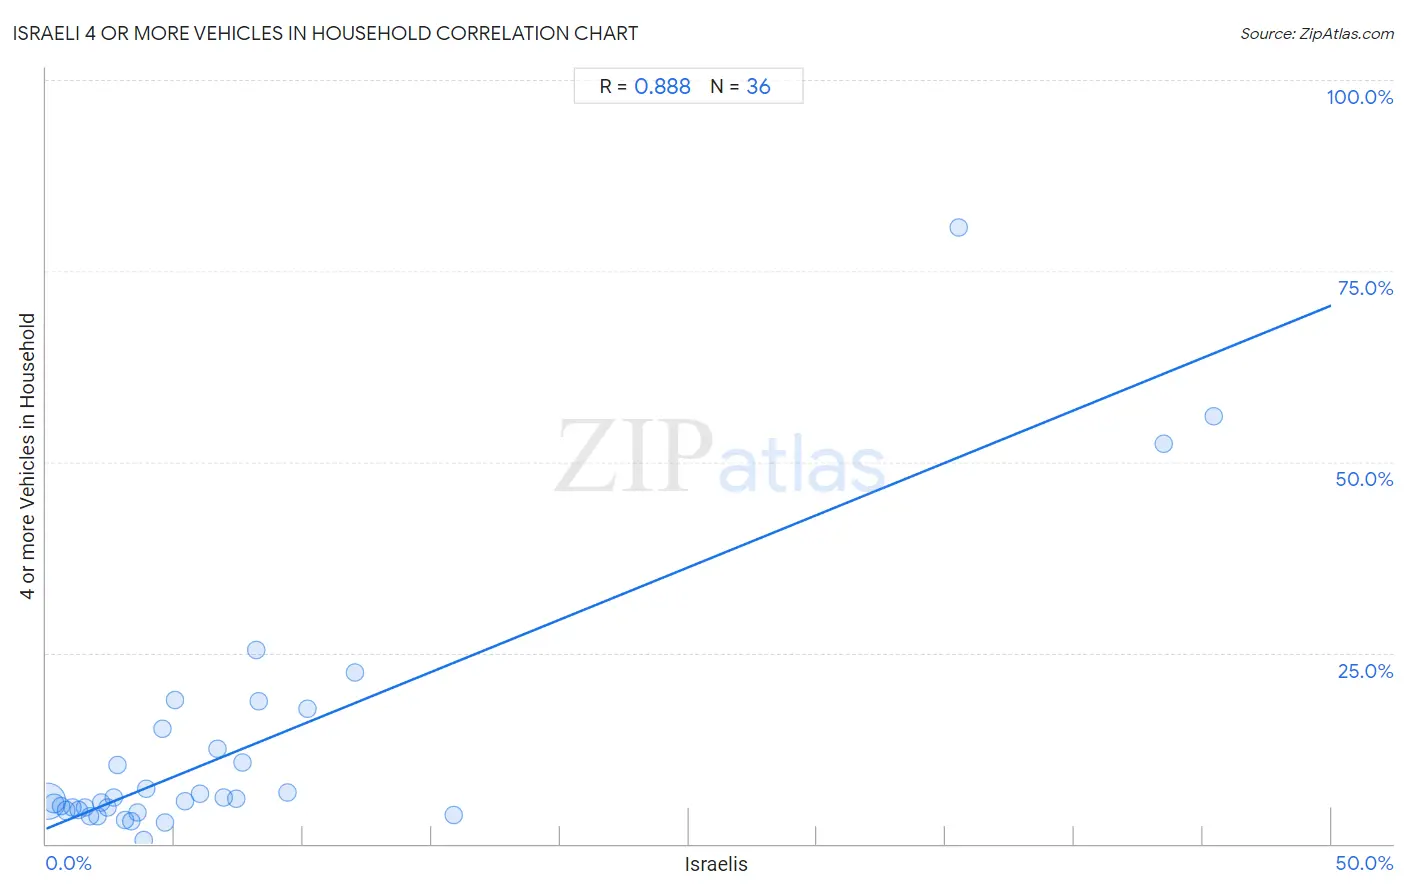
Israeli 4 or more Vehicles in Household Correlation Chart

The statistical analysis conducted on geographies consisting of 209,765,898 people shows a very strong positive correlation between the proportion of Israelis and percentage of households with 4 or more vehicles available in the United States with a correlation coefficient (R) of 0.888 and weighted average of 5.2%. On average, for every 1% (one percent) increase in Israelis within a typical geography, there is an increase of 1.4% in percentage of households with 4 or more vehicles available.
Israeli 4 or more Vehicles in Household
It is essential to understand that the correlation between the percentage of Israelis and percentage of households with 4 or more vehicles available does not imply a direct cause-and-effect relationship. It remains uncertain whether the presence of Israelis influences an upward or downward trend in the level of percentage of households with 4 or more vehicles available within an area, or if Israelis simply ended up residing in those areas with higher or lower levels of percentage of households with 4 or more vehicles available due to other factors.

Demographics Similar to Israelis by 4 or more Vehicles in Household

In terms of 4 or more vehicles in household, the demographic groups most similar to Israelis are Immigrants from Brazil (5.2%, a difference of 0.18%), Ghanaian (5.2%, a difference of 0.29%), Immigrants from Venezuela (5.2%, a difference of 0.29%), Immigrants from Congo (5.2%, a difference of 0.35%), and Liberian (5.3%, a difference of 0.38%).
DemographicsRating | Rank4 or more Vehicles in Household
Immigrants from Bosnia and Herzegovina
0.2
/100
|
#289
Tragic
5.3%
Immigrants from Russia
0.2
/100
|
#290
Tragic
5.3%
Immigrants from Bahamas
0.1
/100
|
#291
Tragic
5.3%
Liberians
0.1
/100
|
#292
Tragic
5.3%
Immigrants from Congo
0.1
/100
|
#293
Tragic
5.2%
Ghanaians
0.1
/100
|
#294
Tragic
5.2%
Immigrants from Brazil
0.1
/100
|
#295
Tragic
5.2%
Israelis
0.1
/100
|
#296
Tragic
5.2%
Immigrants from Venezuela
0.1
/100
|
#297
Tragic
5.2%
Immigrants from South America
0.1
/100
|
#298
Tragic
5.2%
Immigrants from Ghana
0.1
/100
|
#299
Tragic
5.2%
Immigrants from Morocco
0.0
/100
|
#300
Tragic
5.1%
Immigrants from Zaire
0.0
/100
|
#301
Tragic
5.1%
Bahamians
0.0
/100
|
#302
Tragic
5.1%
Immigrants from Greece
0.0
/100
|
#303
Tragic
5.1%

Israeli 4 or more Vehicles in Household Correlation Summary

MeasurementIsraeli Data4 or more Vehicles in Household Data
Minimum0.066%0.51%
Maximum45.4%80.8%
Range45.4%80.3%
Mean7.8%12.6%
Median4.2%5.7%
Interquartile 25% (IQ1)2.1%4.4%
Interquartile 75% (IQ3)7.9%13.7%
Interquartile Range (IQR)5.8%9.3%
Standard Deviation (Sample)11.0%16.9%
Standard Deviation (Population)10.8%16.7%

Correlation Details

Israeli PercentileSample Size4 or more Vehicles in Household
[
0.0%
-
0.5%
]
0.066%
181,864,5815.5%
[
0.0%
-
0.5%
]
0.31%
18,069,2665.3%
[
0.5%
-
1.0%
]
0.57%
4,195,4265.0%
[
0.5%
-
1.0%
]
0.78%
1,972,8354.3%
[
1.0%
-
1.5%
]
1.02%
1,394,9154.8%
[
1.0%
-
1.5%
]
1.26%
624,5894.5%
[
1.5%
-
2.0%
]
1.50%
252,8584.7%
[
1.5%
-
2.0%
]
1.70%
356,4163.6%
[
1.5%
-
2.0%
]
1.99%
236,6353.7%
[
2.0%
-
2.5%
]
2.12%
237,1765.4%
[
2.0%
-
2.5%
]
2.40%
130,5594.8%
[
2.5%
-
3.0%
]
2.63%
66,2016.1%
[
2.5%
-
3.0%
]
2.76%
57,20110.3%
[
3.0%
-
3.5%
]
3.06%
68,9363.1%
[
3.0%
-
3.5%
]
3.29%
70,9402.9%
[
3.5%
-
4.0%
]
3.53%
71,5024.0%
[
3.5%
-
4.0%
]
3.79%
32,8840.51%
[
3.5%
-
4.0%
]
3.90%
5,6177.2%
[
4.5%
-
5.0%
]
4.52%
59815.1%
[
4.5%
-
5.0%
]
4.61%
18,2102.8%
[
5.0%
-
5.5%
]
5.00%
52018.8%
[
5.0%
-
5.5%
]
5.40%
5,3935.5%
[
5.5%
-
6.0%
]
5.98%
8,8516.5%
[
6.5%
-
7.0%
]
6.66%
4,55012.4%
[
6.5%
-
7.0%
]
6.91%
7,3076.0%
[
7.0%
-
7.5%
]
7.39%
7175.9%
[
7.5%
-
8.0%
]
7.65%
81010.7%
[
8.0%
-
8.5%
]
8.15%
31925.3%
[
8.0%
-
8.5%
]
8.26%
1,06618.7%
[
9.0%
-
9.5%
]
9.41%
6,1236.7%
[
10.0%
-
10.5%
]
10.18%
1,36617.7%
[
12.0%
-
12.5%
]
12.03%
34922.4%
[
15.5%
-
16.0%
]
15.84%
4863.7%
[
35.0%
-
35.5%
]
35.48%
9380.8%
[
43.5%
-
44.0%
]
43.51%
30852.4%
[
45.0%
-
45.5%
]
45.42%
29555.9%