Israeli Married-couple Households
COMPARE
Israeli
Select to Compare
Married-couple Households
Israeli Married-couple Households
46.7%
MARRIED-COUPLE HOUSEHOLDS
62.3/ 100
METRIC RATING
168th/ 347
METRIC RANK
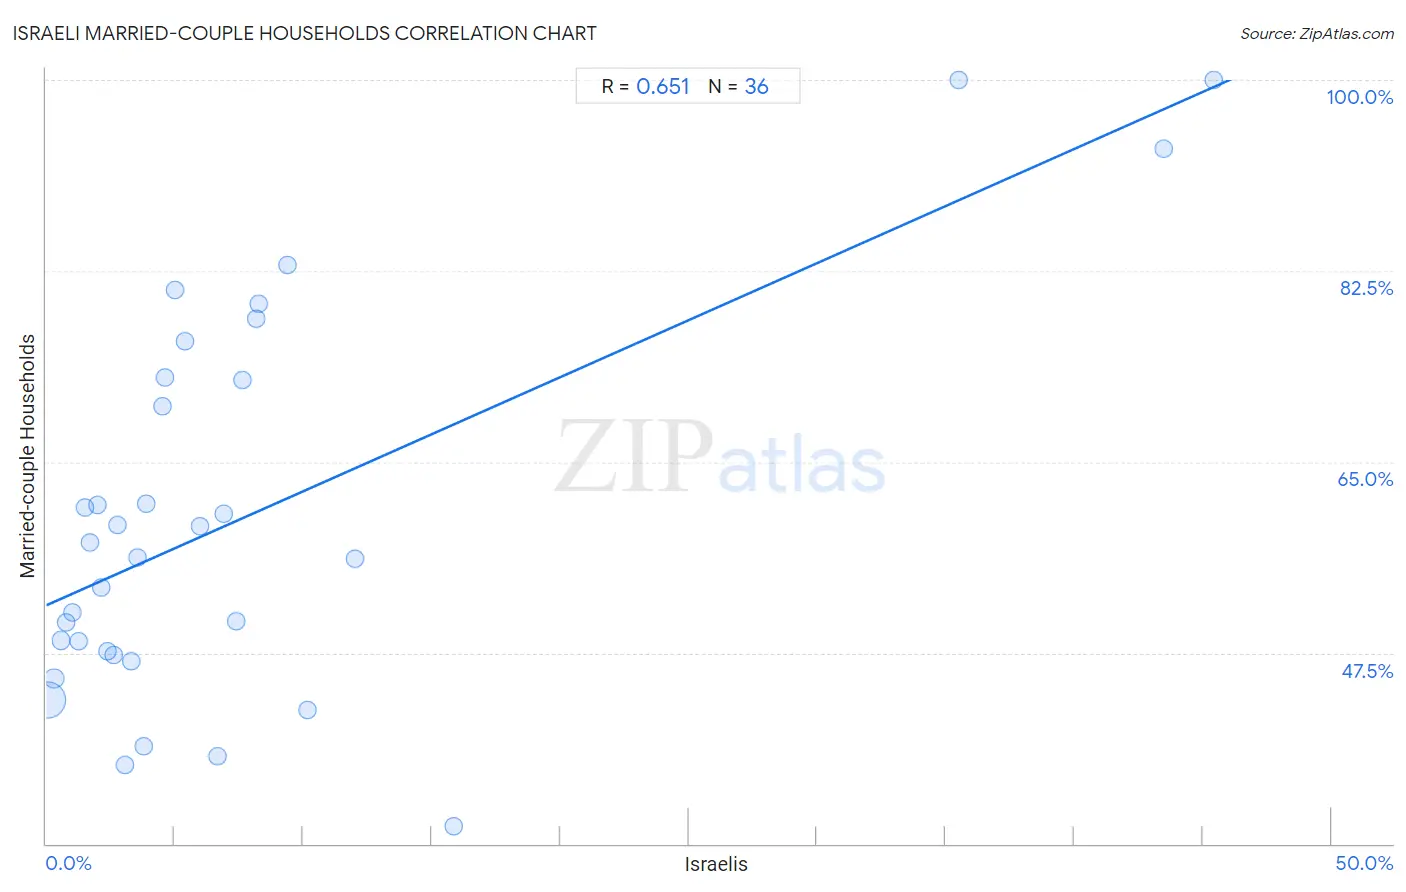
Israeli Married-couple Households Correlation Chart
The statistical analysis conducted on geographies consisting of 210,993,217 people shows a significant positive correlation between the proportion of Israelis and percentage of married-couple family households in the United States with a correlation coefficient (R) of 0.651 and weighted average of 46.7%. On average, for every 1% (one percent) increase in Israelis within a typical geography, there is an increase of 1.0% in percentage of married-couple family households.
It is essential to understand that the correlation between the percentage of Israelis and percentage of married-couple family households does not imply a direct cause-and-effect relationship. It remains uncertain whether the presence of Israelis influences an upward or downward trend in the level of percentage of married-couple family households within an area, or if Israelis simply ended up residing in those areas with higher or lower levels of percentage of married-couple family households due to other factors.
Demographics Similar to Israelis by Married-couple Households
In terms of married-couple households, the demographic groups most similar to Israelis are Immigrants from Croatia (46.7%, a difference of 0.080%), Spanish American Indian (46.6%, a difference of 0.11%), Cherokee (46.7%, a difference of 0.14%), South American (46.6%, a difference of 0.17%), and Immigrants from Chile (46.5%, a difference of 0.25%).
| Demographics | Rating | Rank | Married-couple Households |
| Delaware | 71.2 /100 | #161 | Good 46.8% |
| Colombians | 71.0 /100 | #162 | Good 46.8% |
| Immigrants from Turkey | 70.2 /100 | #163 | Good 46.8% |
| Immigrants from Kazakhstan | 70.0 /100 | #164 | Good 46.8% |
| Immigrants from Southern Europe | 69.9 /100 | #165 | Good 46.8% |
| Cherokee | 65.7 /100 | #166 | Good 46.7% |
| Immigrants from Croatia | 64.2 /100 | #167 | Good 46.7% |
| Israelis | 62.3 /100 | #168 | Good 46.7% |
| Spanish American Indians | 59.4 /100 | #169 | Average 46.6% |
| South Americans | 58.0 /100 | #170 | Average 46.6% |
| Immigrants from Chile | 55.7 /100 | #171 | Average 46.5% |
| Immigrants from Australia | 54.6 /100 | #172 | Average 46.5% |
| Immigrants from Norway | 52.0 /100 | #173 | Average 46.5% |
| Immigrants from Mexico | 50.0 /100 | #174 | Average 46.4% |
| Immigrants from Colombia | 46.1 /100 | #175 | Average 46.4% |
Israeli Married-couple Households Correlation Summary
| Measurement | Israeli Data | Married-couple Households Data |
| Minimum | 0.066% | 31.6% |
| Maximum | 45.4% | 100.0% |
| Range | 45.4% | 68.4% |
| Mean | 7.8% | 60.0% |
| Median | 4.2% | 57.0% |
| Interquartile 25% (IQ1) | 2.1% | 47.5% |
| Interquartile 75% (IQ3) | 7.9% | 72.7% |
| Interquartile Range (IQR) | 5.9% | 25.2% |
| Standard Deviation (Sample) | 11.0% | 17.6% |
| Standard Deviation (Population) | 10.8% | 17.4% |
Correlation Details
| Israeli Percentile | Sample Size | Married-couple Households |
[ 0.0% - 0.5% ] 0.066% | 182,663,181 | 43.1% |
[ 0.0% - 0.5% ] 0.31% | 18,356,017 | 45.1% |
[ 0.5% - 1.0% ] 0.57% | 4,284,024 | 48.6% |
[ 0.5% - 1.0% ] 0.78% | 1,997,519 | 50.3% |
[ 1.0% - 1.5% ] 1.02% | 1,397,733 | 51.2% |
[ 1.0% - 1.5% ] 1.26% | 624,589 | 48.5% |
[ 1.5% - 2.0% ] 1.50% | 254,179 | 60.8% |
[ 1.5% - 2.0% ] 1.70% | 376,622 | 57.6% |
[ 1.5% - 2.0% ] 1.98% | 240,808 | 61.0% |
[ 2.0% - 2.5% ] 2.12% | 237,176 | 53.5% |
[ 2.0% - 2.5% ] 2.40% | 130,559 | 47.7% |
[ 2.5% - 3.0% ] 2.63% | 66,201 | 47.3% |
[ 2.5% - 3.0% ] 2.76% | 57,201 | 59.2% |
[ 3.0% - 3.5% ] 3.06% | 68,936 | 37.2% |
[ 3.0% - 3.5% ] 3.29% | 70,940 | 46.8% |
[ 3.5% - 4.0% ] 3.53% | 71,502 | 56.3% |
[ 3.5% - 4.0% ] 3.79% | 32,884 | 39.0% |
[ 3.5% - 4.0% ] 3.90% | 5,617 | 61.2% |
[ 4.5% - 5.0% ] 4.52% | 598 | 70.0% |
[ 4.5% - 5.0% ] 4.61% | 18,210 | 72.8% |
[ 5.0% - 5.5% ] 5.00% | 520 | 80.7% |
[ 5.0% - 5.5% ] 5.40% | 5,393 | 76.0% |
[ 5.5% - 6.0% ] 5.98% | 8,851 | 59.1% |
[ 6.5% - 7.0% ] 6.66% | 4,550 | 38.0% |
[ 6.5% - 7.0% ] 6.91% | 7,307 | 60.3% |
[ 7.0% - 7.5% ] 7.39% | 717 | 50.3% |
[ 7.5% - 8.0% ] 7.65% | 810 | 72.5% |
[ 8.0% - 8.5% ] 8.15% | 319 | 78.1% |
[ 8.0% - 8.5% ] 8.26% | 1,066 | 79.5% |
[ 9.0% - 9.5% ] 9.41% | 6,123 | 83.0% |
[ 10.0% - 10.5% ] 10.17% | 1,534 | 42.2% |
[ 12.0% - 12.5% ] 12.03% | 349 | 56.1% |
[ 15.5% - 16.0% ] 15.84% | 486 | 31.6% |
[ 35.0% - 35.5% ] 35.48% | 93 | 100.0% |
[ 43.5% - 44.0% ] 43.51% | 308 | 93.7% |
[ 45.0% - 45.5% ] 45.42% | 295 | 100.0% |