Israeli Self-Care Disability
COMPARE
Israeli
Select to Compare
Self-Care Disability
Israeli Self-Care Disability
2.4%
SELF-CARE DISABILITY
80.0/ 100
METRIC RATING
146th/ 347
METRIC RANK
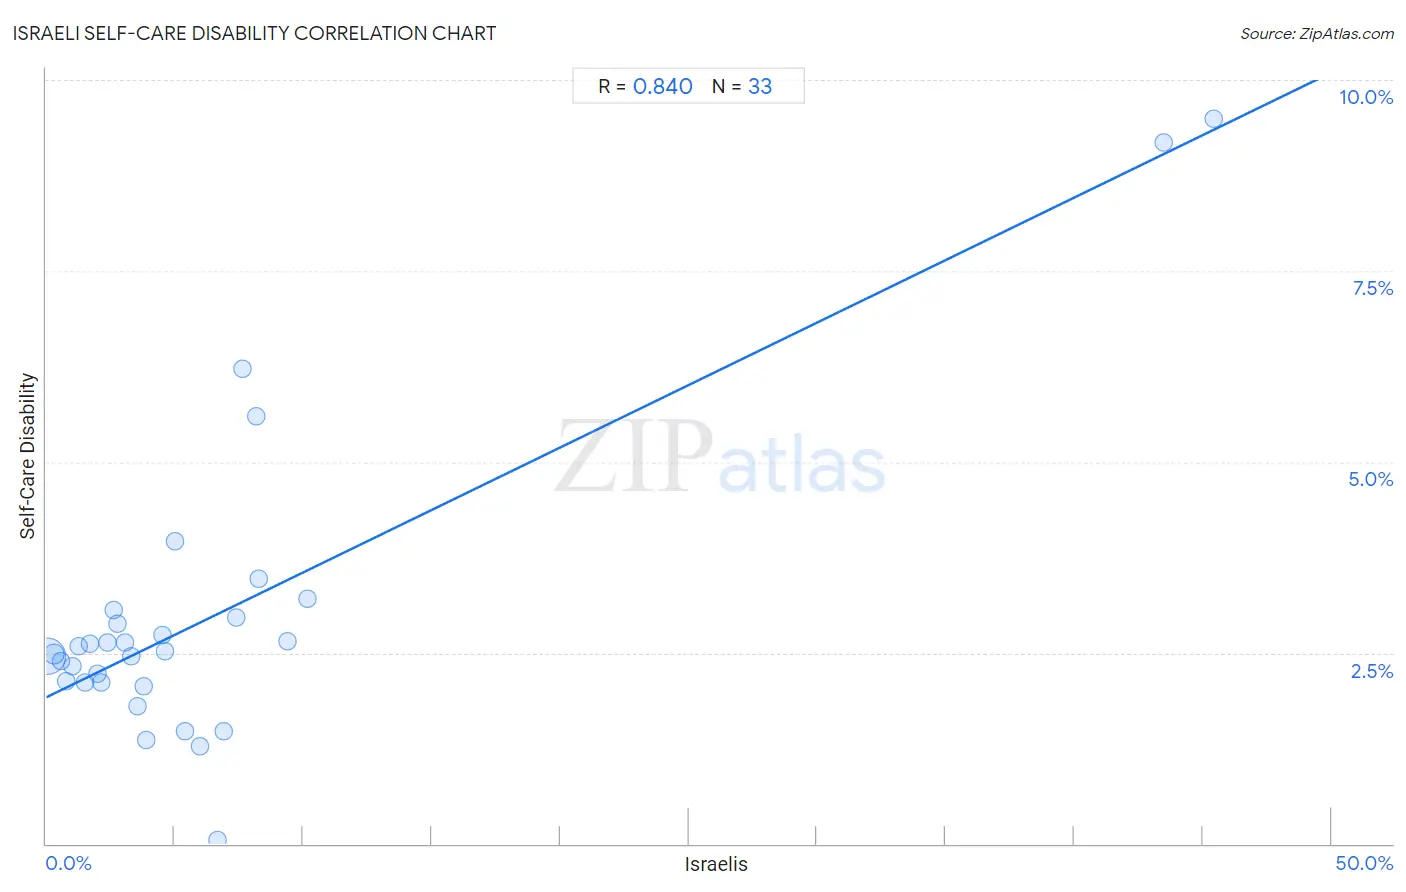
Israeli Self-Care Disability Correlation Chart
The statistical analysis conducted on geographies consisting of 210,973,886 people shows a very strong positive correlation between the proportion of Israelis and percentage of population with self-care disability in the United States with a correlation coefficient (R) of 0.840 and weighted average of 2.4%. On average, for every 1% (one percent) increase in Israelis within a typical geography, there is an increase of 0.16% in percentage of population with self-care disability.
It is essential to understand that the correlation between the percentage of Israelis and percentage of population with self-care disability does not imply a direct cause-and-effect relationship. It remains uncertain whether the presence of Israelis influences an upward or downward trend in the level of percentage of population with self-care disability within an area, or if Israelis simply ended up residing in those areas with higher or lower levels of percentage of population with self-care disability due to other factors.
Demographics Similar to Israelis by Self-Care Disability
In terms of self-care disability, the demographic groups most similar to Israelis are German (2.4%, a difference of 0.010%), Costa Rican (2.4%, a difference of 0.060%), Afghan (2.4%, a difference of 0.18%), Dutch (2.4%, a difference of 0.18%), and Immigrants from Peru (2.4%, a difference of 0.26%).
| Demographics | Rating | Rank | Self-Care Disability |
| Sri Lankans | 86.6 /100 | #139 | Excellent 2.4% |
| Immigrants from Uruguay | 85.4 /100 | #140 | Excellent 2.4% |
| Alaska Natives | 84.5 /100 | #141 | Excellent 2.4% |
| Immigrants from Peru | 83.2 /100 | #142 | Excellent 2.4% |
| Afghans | 82.3 /100 | #143 | Excellent 2.4% |
| Costa Ricans | 80.8 /100 | #144 | Excellent 2.4% |
| Germans | 80.1 /100 | #145 | Excellent 2.4% |
| Israelis | 80.0 /100 | #146 | Good 2.4% |
| Dutch | 77.5 /100 | #147 | Good 2.4% |
| Romanians | 75.8 /100 | #148 | Good 2.4% |
| Arabs | 75.7 /100 | #149 | Good 2.4% |
| Immigrants from Costa Rica | 75.1 /100 | #150 | Good 2.4% |
| Basques | 74.0 /100 | #151 | Good 2.4% |
| Tlingit-Haida | 73.5 /100 | #152 | Good 2.4% |
| Immigrants from England | 73.5 /100 | #153 | Good 2.4% |
Israeli Self-Care Disability Correlation Summary
| Measurement | Israeli Data | Self-Care Disability Data |
| Minimum | 0.066% | 0.046% |
| Maximum | 45.4% | 9.5% |
| Range | 45.4% | 9.4% |
| Mean | 6.5% | 3.0% |
| Median | 3.8% | 2.5% |
| Interquartile 25% (IQ1) | 1.8% | 2.1% |
| Interquartile 75% (IQ3) | 7.2% | 3.0% |
| Interquartile Range (IQR) | 5.3% | 0.90% |
| Standard Deviation (Sample) | 10.2% | 2.0% |
| Standard Deviation (Population) | 10.0% | 2.0% |
Correlation Details
| Israeli Percentile | Sample Size | Self-Care Disability |
[ 0.0% - 0.5% ] 0.066% | 182,660,846 | 2.5% |
[ 0.0% - 0.5% ] 0.31% | 18,355,433 | 2.5% |
[ 0.5% - 1.0% ] 0.57% | 4,272,085 | 2.4% |
[ 0.5% - 1.0% ] 0.78% | 2,002,962 | 2.1% |
[ 1.0% - 1.5% ] 1.02% | 1,396,767 | 2.3% |
[ 1.0% - 1.5% ] 1.26% | 624,589 | 2.6% |
[ 1.5% - 2.0% ] 1.50% | 254,179 | 2.1% |
[ 1.5% - 2.0% ] 1.70% | 376,622 | 2.6% |
[ 1.5% - 2.0% ] 1.98% | 236,725 | 2.2% |
[ 2.0% - 2.5% ] 2.12% | 237,176 | 2.1% |
[ 2.0% - 2.5% ] 2.40% | 128,524 | 2.6% |
[ 2.5% - 3.0% ] 2.63% | 66,201 | 3.1% |
[ 2.5% - 3.0% ] 2.76% | 57,201 | 2.9% |
[ 3.0% - 3.5% ] 3.06% | 68,936 | 2.6% |
[ 3.0% - 3.5% ] 3.29% | 70,940 | 2.4% |
[ 3.5% - 4.0% ] 3.53% | 71,502 | 1.8% |
[ 3.5% - 4.0% ] 3.79% | 32,830 | 2.1% |
[ 3.5% - 4.0% ] 3.87% | 4,336 | 1.4% |
[ 4.5% - 5.0% ] 4.52% | 598 | 2.7% |
[ 4.5% - 5.0% ] 4.61% | 18,210 | 2.5% |
[ 5.0% - 5.5% ] 5.00% | 520 | 4.0% |
[ 5.0% - 5.5% ] 5.40% | 5,393 | 1.5% |
[ 5.5% - 6.0% ] 5.98% | 8,450 | 1.3% |
[ 6.5% - 7.0% ] 6.66% | 4,550 | 0.046% |
[ 6.5% - 7.0% ] 6.91% | 7,307 | 1.5% |
[ 7.0% - 7.5% ] 7.39% | 717 | 3.0% |
[ 7.5% - 8.0% ] 7.65% | 810 | 6.2% |
[ 8.0% - 8.5% ] 8.15% | 319 | 5.6% |
[ 8.0% - 8.5% ] 8.26% | 1,066 | 3.5% |
[ 9.0% - 9.5% ] 9.41% | 6,123 | 2.6% |
[ 10.0% - 10.5% ] 10.18% | 1,366 | 3.2% |
[ 43.5% - 44.0% ] 43.51% | 308 | 9.2% |
[ 45.0% - 45.5% ] 45.42% | 295 | 9.5% |