Iranian 3 or more Vehicles in Household

COMPARE

Iranian
Race
Ancestry
AfghanAfricanAlaska NativeAlaskan AthabascanAlbanianAleutAlsatianAmericanApacheArabArapahoArgentineanArmenianAssyrian/Chaldean/SyriacAustralianAustrianBahamianBangladeshiBarbadianBasqueBelgianBelizeanBermudanBhutaneseBlackfeetBolivianBrazilianBritishBritish West IndianBulgarianBurmeseCajunCambodianCanadianCape VerdeanCarpatho RusynCelticCentral AmericanCentral American IndianCherokeeCheyenneChickasawChileanChineseChippewaChoctawColombianColvilleComancheCosta RicanCreeCreekCroatianCrowCubanCypriotCzechCzechoslovakianDanishDelawareDominicanDutchDutch West IndianEastern EuropeanEcuadorianEgyptianEnglishEstonianEthiopianEuropeanFijianFilipinoFinnishFrenchFrench American IndianFrench CanadianGermanGerman RussianGhanaianGreekGuamanian/ChamorroGuatemalanGuyaneseHaitianHmongHonduranHopiHoumaHungarianIcelanderIndian (Asian)IndonesianInupiatIranianIraqiIrishIroquoisIsraeliItalianJamaicanJapaneseJordanianKenyanKiowaKoreanLaotianLatvianLebaneseLiberianLithuanianLumbeeLuxembourgerMacedonianMalaysianMalteseMarshalleseMenomineeMexicanMexican American IndianMongolianMoroccanNative HawaiianNavajoNepaleseNew ZealanderNicaraguanNigerianNorthern EuropeanNorwegianOkinawanOsageOttawaPaiutePakistaniPalestinianPanamanianParaguayanPennsylvania GermanPeruvianPimaPolishPortuguesePotawatomiPuebloPuerto RicanPuget Sound SalishRomanianRussianSalvadoranSamoanScandinavianScotch-IrishScottishSeminoleSenegaleseSerbianShoshoneSierra LeoneanSiouxSlavicSlovakSloveneSomaliSouth AfricanSouth AmericanSouth American IndianSoviet UnionSpaniardSpanishSpanish AmericanSpanish American IndianSri LankanSubsaharan AfricanSudaneseSwedishSwissSyrianTaiwaneseThaiTlingit-HaidaTohono O'OdhamTonganTrinidadian and TobagonianTsimshianTurkishU.S. Virgin IslanderUgandanUkrainianUruguayanUteVenezuelanVietnameseWelshWest IndianYakamaYaquiYugoslavianYumanYup'ikZimbabwean
Immigration
NonimmigrantsImmigrantsAfghanistanAfricaAlbaniaArgentinaArmeniaAsiaAustraliaAustriaBahamasBangladeshBarbadosBelarusBelgiumBelizeBoliviaBosnia and HerzegovinaBrazilBulgariaBurma/MyanmarCabo VerdeCambodiaCameroonCanadaCaribbeanCentral AmericaChileChinaColombiaCongoCosta RicaCroatiaCubaCzechoslovakiaDenmarkDominicaDominican RepublicEastern AfricaEastern AsiaEastern EuropeEcuadorEgyptEl SalvadorEnglandEritreaEthiopiaEuropeFijiFranceGermanyGhanaGreeceGrenadaGuatemalaGuyanaHaitiHondurasHong KongHungaryIndiaIndonesiaIranIraqIrelandIsraelItalyJamaicaJapanJordanKazakhstanKenyaKoreaKuwaitLaosLatin AmericaLatviaLebanonLiberiaLithuaniaMalaysiaMexicoMicronesiaMiddle AfricaMoldovaMoroccoNepalNetherlandsNicaraguaNigeriaNorth AmericaNorth MacedoniaNorthern AfricaNorthern EuropeNorwayOceaniaPakistanPanamaPeruPhilippinesPolandPortugalRomaniaRussiaSaudi ArabiaScotlandSenegalSerbiaSierra LeoneSingaporeSomaliaSouth AfricaSouth AmericaSouth Central AsiaSouth Eastern AsiaSouthern EuropeSpainSri LankaSt. Vincent and the GrenadinesSudanSwedenSwitzerlandSyriaTaiwanThailandTrinidad and TobagoTurkeyUgandaUkraineUruguayUzbekistanVenezuelaVietnamWest IndiesWestern AfricaWestern AsiaWestern EuropeYemenZaireZimbabweAzores
Select to Compare
Race
Ancestry
AfghanAfricanAlaska NativeAlaskan AthabascanAlbanianAleutAlsatianAmericanApacheArabArapahoArgentineanArmenianAssyrian/Chaldean/SyriacAustralianAustrianBahamianBangladeshiBarbadianBasqueBelgianBelizeanBermudanBhutaneseBlackfeetBolivianBrazilianBritishBritish West IndianBulgarianBurmeseCajunCambodianCanadianCape VerdeanCarpatho RusynCelticCentral AmericanCentral American IndianCherokeeCheyenneChickasawChileanChineseChippewaChoctawColombianColvilleComancheCosta RicanCreeCreekCroatianCrowCubanCypriotCzechCzechoslovakianDanishDelawareDominicanDutchDutch West IndianEastern EuropeanEcuadorianEgyptianEnglishEstonianEthiopianEuropeanFijianFilipinoFinnishFrenchFrench American IndianFrench CanadianGermanGerman RussianGhanaianGreekGuamanian/ChamorroGuatemalanGuyaneseHaitianHmongHonduranHopiHoumaHungarianIcelanderIndian (Asian)IndonesianInupiatIraqiIrishIroquoisIsraeliItalianJamaicanJapaneseJordanianKenyanKiowaKoreanLaotianLatvianLebaneseLiberianLithuanianLumbeeLuxembourgerMacedonianMalaysianMalteseMarshalleseMenomineeMexicanMexican American IndianMongolianMoroccanNative HawaiianNavajoNepaleseNew ZealanderNicaraguanNigerianNorthern EuropeanNorwegianOkinawanOsageOttawaPaiutePakistaniPalestinianPanamanianParaguayanPennsylvania GermanPeruvianPimaPolishPortuguesePotawatomiPuebloPuerto RicanPuget Sound SalishRomanianRussianSalvadoranSamoanScandinavianScotch-IrishScottishSeminoleSenegaleseSerbianShoshoneSierra LeoneanSiouxSlavicSlovakSloveneSomaliSouth AfricanSouth AmericanSouth American IndianSoviet UnionSpaniardSpanishSpanish AmericanSpanish American IndianSri LankanSubsaharan AfricanSudaneseSwedishSwissSyrianTaiwaneseThaiTlingit-HaidaTohono O'OdhamTonganTrinidadian and TobagonianTsimshianTurkishU.S. Virgin IslanderUgandanUkrainianUruguayanUteVenezuelanVietnameseWelshWest IndianYakamaYaquiYugoslavianYumanYup'ikZimbabwean
Immigration
NonimmigrantsImmigrantsAfghanistanAfricaAlbaniaArgentinaArmeniaAsiaAustraliaAustriaBahamasBangladeshBarbadosBelarusBelgiumBelizeBoliviaBosnia and HerzegovinaBrazilBulgariaBurma/MyanmarCabo VerdeCambodiaCameroonCanadaCaribbeanCentral AmericaChileChinaColombiaCongoCosta RicaCroatiaCubaCzechoslovakiaDenmarkDominicaDominican RepublicEastern AfricaEastern AsiaEastern EuropeEcuadorEgyptEl SalvadorEnglandEritreaEthiopiaEuropeFijiFranceGermanyGhanaGreeceGrenadaGuatemalaGuyanaHaitiHondurasHong KongHungaryIndiaIndonesiaIranIraqIrelandIsraelItalyJamaicaJapanJordanKazakhstanKenyaKoreaKuwaitLaosLatin AmericaLatviaLebanonLiberiaLithuaniaMalaysiaMexicoMicronesiaMiddle AfricaMoldovaMoroccoNepalNetherlandsNicaraguaNigeriaNorth AmericaNorth MacedoniaNorthern AfricaNorthern EuropeNorwayOceaniaPakistanPanamaPeruPhilippinesPolandPortugalRomaniaRussiaSaudi ArabiaScotlandSenegalSerbiaSierra LeoneSingaporeSomaliaSouth AfricaSouth AmericaSouth Central AsiaSouth Eastern AsiaSouthern EuropeSpainSri LankaSt. Vincent and the GrenadinesSudanSwedenSwitzerlandSyriaTaiwanThailandTrinidad and TobagoTurkeyUgandaUkraineUruguayUzbekistanVenezuelaVietnamWest IndiesWestern AfricaWestern AsiaWestern EuropeYemenZaireZimbabweAzores
3 or more Vehicles in Household
Income
Poverty
Unemployment
Labor Participation
Family Structure
Vehicle Availability
Education Level
Disability

Iranian 3 or more Vehicles in Household
Excellent

20.1%
3+ VEHICLES AVAILABLE
84.0/ 100
METRIC RATING
144th/ 347
METRIC RANK

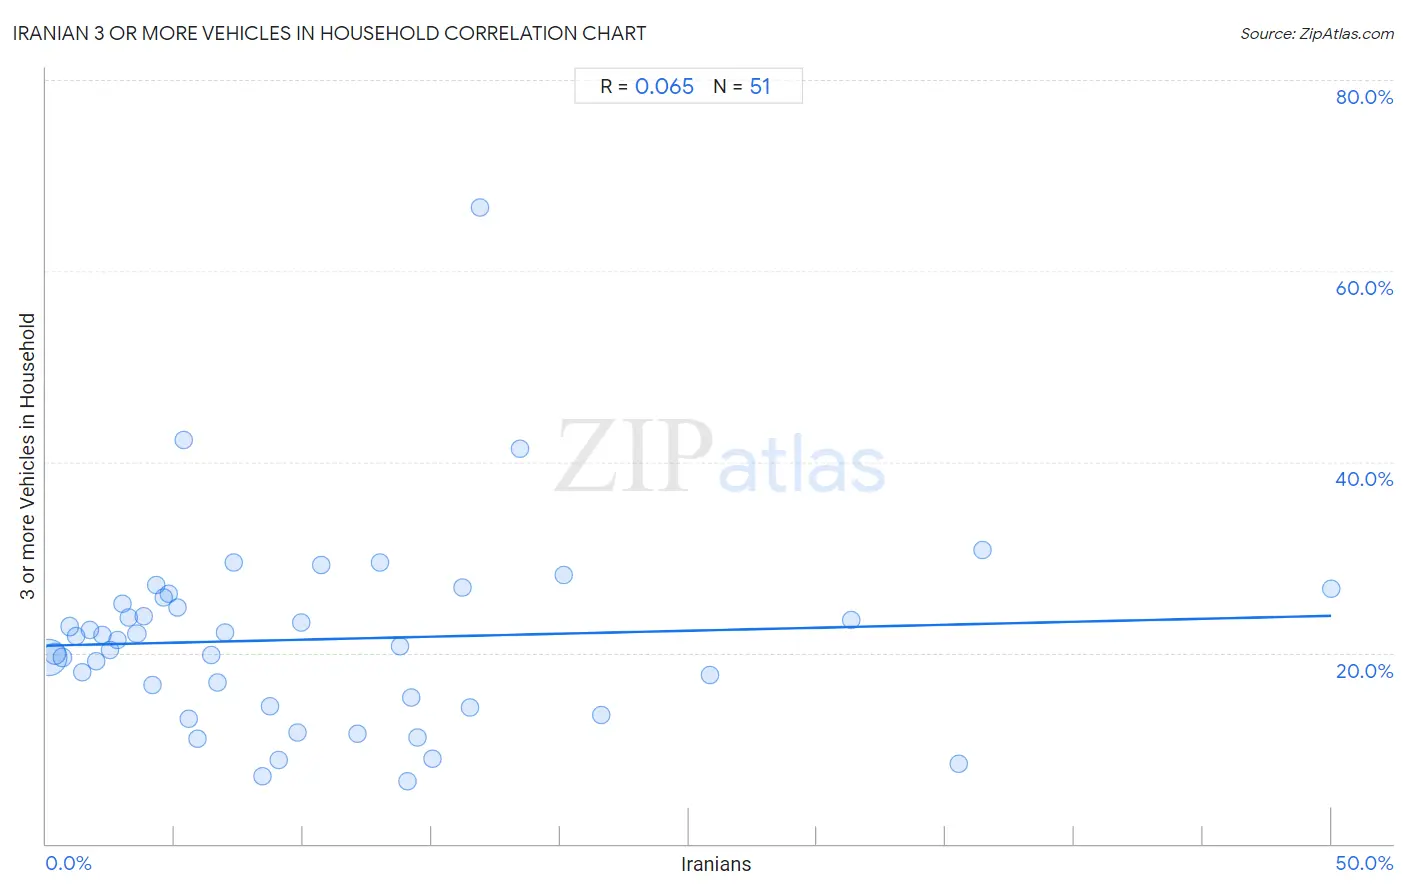
Iranian 3 or more Vehicles in Household Correlation Chart

The statistical analysis conducted on geographies consisting of 316,534,374 people shows a slight positive correlation between the proportion of Iranians and percentage of households with 3 or more vehicles available in the United States with a correlation coefficient (R) of 0.065 and weighted average of 20.1%. On average, for every 1% (one percent) increase in Iranians within a typical geography, there is an increase of 0.062% in percentage of households with 3 or more vehicles available.
Iranian 3 or more Vehicles in Household
It is essential to understand that the correlation between the percentage of Iranians and percentage of households with 3 or more vehicles available does not imply a direct cause-and-effect relationship. It remains uncertain whether the presence of Iranians influences an upward or downward trend in the level of percentage of households with 3 or more vehicles available within an area, or if Iranians simply ended up residing in those areas with higher or lower levels of percentage of households with 3 or more vehicles available due to other factors.

Demographics Similar to Iranians by 3 or more Vehicles in Household

In terms of 3 or more vehicles in household, the demographic groups most similar to Iranians are Palestinian (20.1%, a difference of 0.010%), Lithuanian (20.1%, a difference of 0.050%), Australian (20.1%, a difference of 0.050%), Jordanian (20.1%, a difference of 0.060%), and Ottawa (20.1%, a difference of 0.12%).
DemographicsRating | Rank3 or more Vehicles in Household
Immigrants from Iraq
87.1
/100
|
#137
Excellent
20.2%
Aleuts
86.3
/100
|
#138
Excellent
20.2%
Slovenes
85.5
/100
|
#139
Excellent
20.2%
French American Indians
85.3
/100
|
#140
Excellent
20.1%
Ottawa
84.9
/100
|
#141
Excellent
20.1%
Jordanians
84.4
/100
|
#142
Excellent
20.1%
Lithuanians
84.4
/100
|
#143
Excellent
20.1%
Iranians
84.0
/100
|
#144
Excellent
20.1%
Palestinians
83.9
/100
|
#145
Excellent
20.1%
Australians
83.6
/100
|
#146
Excellent
20.1%
Slovaks
83.0
/100
|
#147
Excellent
20.1%
Guatemalans
82.6
/100
|
#148
Excellent
20.1%
Immigrants from Iran
80.9
/100
|
#149
Excellent
20.0%
Immigrants
80.8
/100
|
#150
Excellent
20.0%
Taiwanese
80.6
/100
|
#151
Excellent
20.0%

Iranian 3 or more Vehicles in Household Correlation Summary

MeasurementIranian Data3 or more Vehicles in Household Data
Minimum0.097%6.6%
Maximum50.0%66.7%
Range49.9%60.1%
Mean10.6%21.4%
Median6.9%21.4%
Interquartile 25% (IQ1)3.2%14.4%
Interquartile 75% (IQ3)14.5%25.7%
Interquartile Range (IQR)11.2%11.3%
Standard Deviation (Sample)10.4%10.1%
Standard Deviation (Population)10.3%10.0%

Correlation Details

Iranian PercentileSample Size3 or more Vehicles in Household
[
0.0%
-
0.5%
]
0.097%
228,703,43519.5%
[
0.0%
-
0.5%
]
0.36%
45,714,27420.0%
[
0.5%
-
1.0%
]
0.63%
16,955,91219.6%
[
0.5%
-
1.0%
]
0.91%
7,308,64822.8%
[
1.0%
-
1.5%
]
1.17%
4,461,39321.8%
[
1.0%
-
1.5%
]
1.39%
6,260,99817.9%
[
1.5%
-
2.0%
]
1.69%
1,876,77222.4%
[
1.5%
-
2.0%
]
1.93%
913,16819.2%
[
2.0%
-
2.5%
]
2.20%
716,33721.9%
[
2.0%
-
2.5%
]
2.47%
562,06720.3%
[
2.5%
-
3.0%
]
2.79%
556,33621.4%
[
2.5%
-
3.0%
]
2.95%
246,19225.2%
[
3.0%
-
3.5%
]
3.22%
274,43923.7%
[
3.5%
-
4.0%
]
3.53%
597,93522.0%
[
3.5%
-
4.0%
]
3.82%
257,34923.8%
[
4.0%
-
4.5%
]
4.13%
74,77316.6%
[
4.0%
-
4.5%
]
4.29%
95,98927.2%
[
4.5%
-
5.0%
]
4.59%
81,13125.7%
[
4.5%
-
5.0%
]
4.77%
175,44926.2%
[
5.0%
-
5.5%
]
5.11%
8,20524.7%
[
5.0%
-
5.5%
]
5.34%
13,17542.2%
[
5.5%
-
6.0%
]
5.54%
24,16713.1%
[
5.5%
-
6.0%
]
5.89%
82,11710.9%
[
6.0%
-
6.5%
]
6.44%
71,12919.8%
[
6.5%
-
7.0%
]
6.68%
69,27816.9%
[
6.5%
-
7.0%
]
6.94%
35,33322.2%
[
7.0%
-
7.5%
]
7.27%
26,31829.5%
[
8.0%
-
8.5%
]
8.41%
52,7417.1%
[
8.5%
-
9.0%
]
8.72%
64,48514.4%
[
9.0%
-
9.5%
]
9.06%
50,3928.7%
[
9.5%
-
10.0%
]
9.77%
37,70511.6%
[
9.5%
-
10.0%
]
9.92%
23,66923.2%
[
10.5%
-
11.0%
]
10.72%
9,16929.2%
[
12.0%
-
12.5%
]
12.13%
5,58911.5%
[
12.5%
-
13.0%
]
12.98%
7,86829.5%
[
13.5%
-
14.0%
]
13.77%
1,44520.7%
[
14.0%
-
14.5%
]
14.05%
11,0326.6%
[
14.0%
-
14.5%
]
14.21%
36615.3%
[
14.0%
-
14.5%
]
14.47%
9,69911.2%
[
15.0%
-
15.5%
]
15.02%
11,0608.9%
[
16.0%
-
16.5%
]
16.20%
16,65226.9%
[
16.5%
-
17.0%
]
16.51%
32,96314.3%
[
16.5%
-
17.0%
]
16.88%
7766.7%
[
18.0%
-
18.5%
]
18.45%
23341.4%
[
20.0%
-
20.5%
]
20.15%
19,18028.1%
[
21.5%
-
22.0%
]
21.60%
1,13913.5%
[
25.5%
-
26.0%
]
25.85%
1,20717.7%
[
31.0%
-
31.5%
]
31.30%
9,10523.4%
[
35.5%
-
36.0%
]
35.51%
6428.3%
[
36.0%
-
36.5%
]
36.42%
5,59330.8%
[
50.0%
-
50.5%
]
50.00%
4426.7%