Iranian Disability Age Under 5
COMPARE
Iranian
Select to Compare
Disability Age Under 5
Iranian Disability Age Under 5
1.0%
DISABILITY | AGE UNDER 5
99.9/ 100
METRIC RATING
32nd/ 347
METRIC RANK
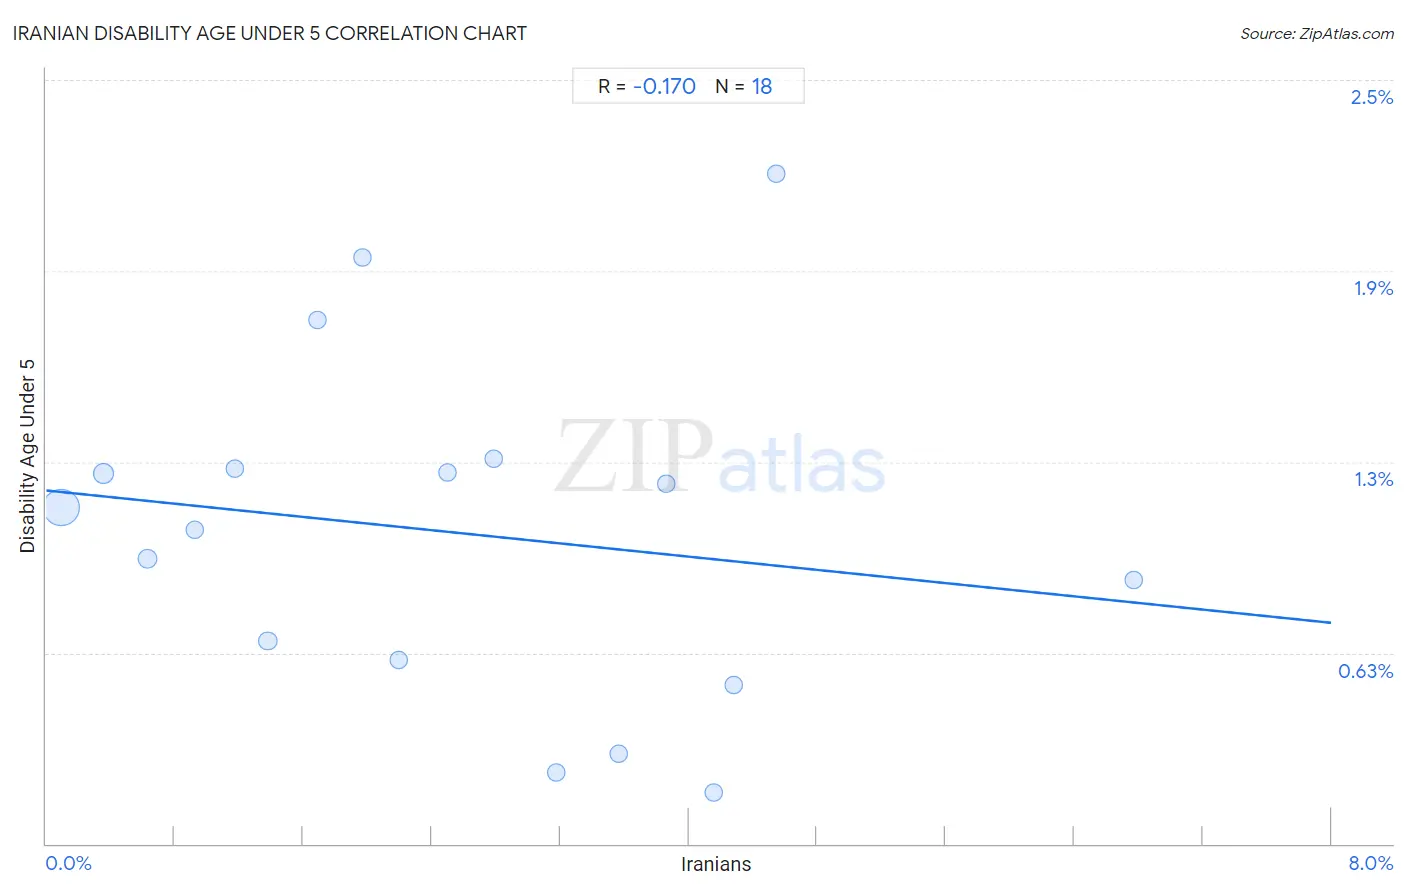
Iranian Disability Age Under 5 Correlation Chart
The statistical analysis conducted on geographies consisting of 185,162,797 people shows a poor negative correlation between the proportion of Iranians and percentage of population with a disability under the age of 5 in the United States with a correlation coefficient (R) of -0.170 and weighted average of 1.0%. On average, for every 1% (one percent) increase in Iranians within a typical geography, there is a decrease of 0.054% in percentage of population with a disability under the age of 5.
It is essential to understand that the correlation between the percentage of Iranians and percentage of population with a disability under the age of 5 does not imply a direct cause-and-effect relationship. It remains uncertain whether the presence of Iranians influences an upward or downward trend in the level of percentage of population with a disability under the age of 5 within an area, or if Iranians simply ended up residing in those areas with higher or lower levels of percentage of population with a disability under the age of 5 due to other factors.
Demographics Similar to Iranians by Disability Age Under 5
In terms of disability age under 5, the demographic groups most similar to Iranians are Armenian (1.0%, a difference of 0.050%), Bolivian (1.0%, a difference of 0.17%), Immigrants from Ukraine (1.0%, a difference of 0.29%), Immigrants from South Central Asia (1.0%, a difference of 0.33%), and Barbadian (1.0%, a difference of 0.53%).
| Demographics | Rating | Rank | Disability Age Under 5 |
| Immigrants from Micronesia | 100.0 /100 | #25 | Exceptional 1.0% |
| Immigrants from Taiwan | 100.0 /100 | #26 | Exceptional 1.0% |
| Guyanese | 100.0 /100 | #27 | Exceptional 1.0% |
| Immigrants from Eastern Asia | 100.0 /100 | #28 | Exceptional 1.0% |
| Immigrants from Belarus | 100.0 /100 | #29 | Exceptional 1.0% |
| Immigrants from South Central Asia | 99.9 /100 | #30 | Exceptional 1.0% |
| Armenians | 99.9 /100 | #31 | Exceptional 1.0% |
| Iranians | 99.9 /100 | #32 | Exceptional 1.0% |
| Bolivians | 99.9 /100 | #33 | Exceptional 1.0% |
| Immigrants from Ukraine | 99.9 /100 | #34 | Exceptional 1.0% |
| Barbadians | 99.9 /100 | #35 | Exceptional 1.0% |
| Immigrants from Nepal | 99.9 /100 | #36 | Exceptional 1.0% |
| Immigrants from India | 99.9 /100 | #37 | Exceptional 1.0% |
| Immigrants from Guyana | 99.9 /100 | #38 | Exceptional 1.0% |
| Filipinos | 99.9 /100 | #39 | Exceptional 1.1% |
Iranian Disability Age Under 5 Correlation Summary
| Measurement | Iranian Data | Disability Age Under 5 Data |
| Minimum | 0.096% | 0.17% |
| Maximum | 6.8% | 2.2% |
| Range | 6.7% | 2.0% |
| Mean | 2.6% | 1.0% |
| Median | 2.3% | 1.1% |
| Interquartile 25% (IQ1) | 1.2% | 0.60% |
| Interquartile 75% (IQ3) | 3.9% | 1.2% |
| Interquartile Range (IQR) | 2.7% | 0.63% |
| Standard Deviation (Sample) | 1.8% | 0.56% |
| Standard Deviation (Population) | 1.7% | 0.54% |
Correlation Details
| Iranian Percentile | Sample Size | Disability Age Under 5 |
[ 0.0% - 0.5% ] 0.096% | 141,381,761 | 1.1% |
[ 0.0% - 0.5% ] 0.36% | 22,339,274 | 1.2% |
[ 0.5% - 1.0% ] 0.63% | 9,550,937 | 0.93% |
[ 0.5% - 1.0% ] 0.93% | 3,341,076 | 1.0% |
[ 1.0% - 1.5% ] 1.18% | 1,989,722 | 1.2% |
[ 1.0% - 1.5% ] 1.38% | 4,442,896 | 0.66% |
[ 1.5% - 2.0% ] 1.69% | 670,778 | 1.7% |
[ 1.5% - 2.0% ] 1.97% | 262,215 | 1.9% |
[ 2.0% - 2.5% ] 2.20% | 114,597 | 0.60% |
[ 2.0% - 2.5% ] 2.50% | 218,509 | 1.2% |
[ 2.5% - 3.0% ] 2.78% | 190,896 | 1.3% |
[ 3.0% - 3.5% ] 3.17% | 93,233 | 0.23% |
[ 3.5% - 4.0% ] 3.56% | 304,527 | 0.30% |
[ 3.5% - 4.0% ] 3.86% | 87,323 | 1.2% |
[ 4.0% - 4.5% ] 4.16% | 59,386 | 0.17% |
[ 4.0% - 4.5% ] 4.28% | 78,226 | 0.52% |
[ 4.5% - 5.0% ] 4.55% | 10,846 | 2.2% |
[ 6.5% - 7.0% ] 6.77% | 26,595 | 0.86% |