Iranian Receiving Food Stamps
COMPARE
Iranian
Select to Compare
Receiving Food Stamps
Iranian Receiving Food Stamps
7.9%
PUBLIC INCOME | FOOD STAMPS
100.0/ 100
METRIC RATING
4th/ 347
METRIC RANK
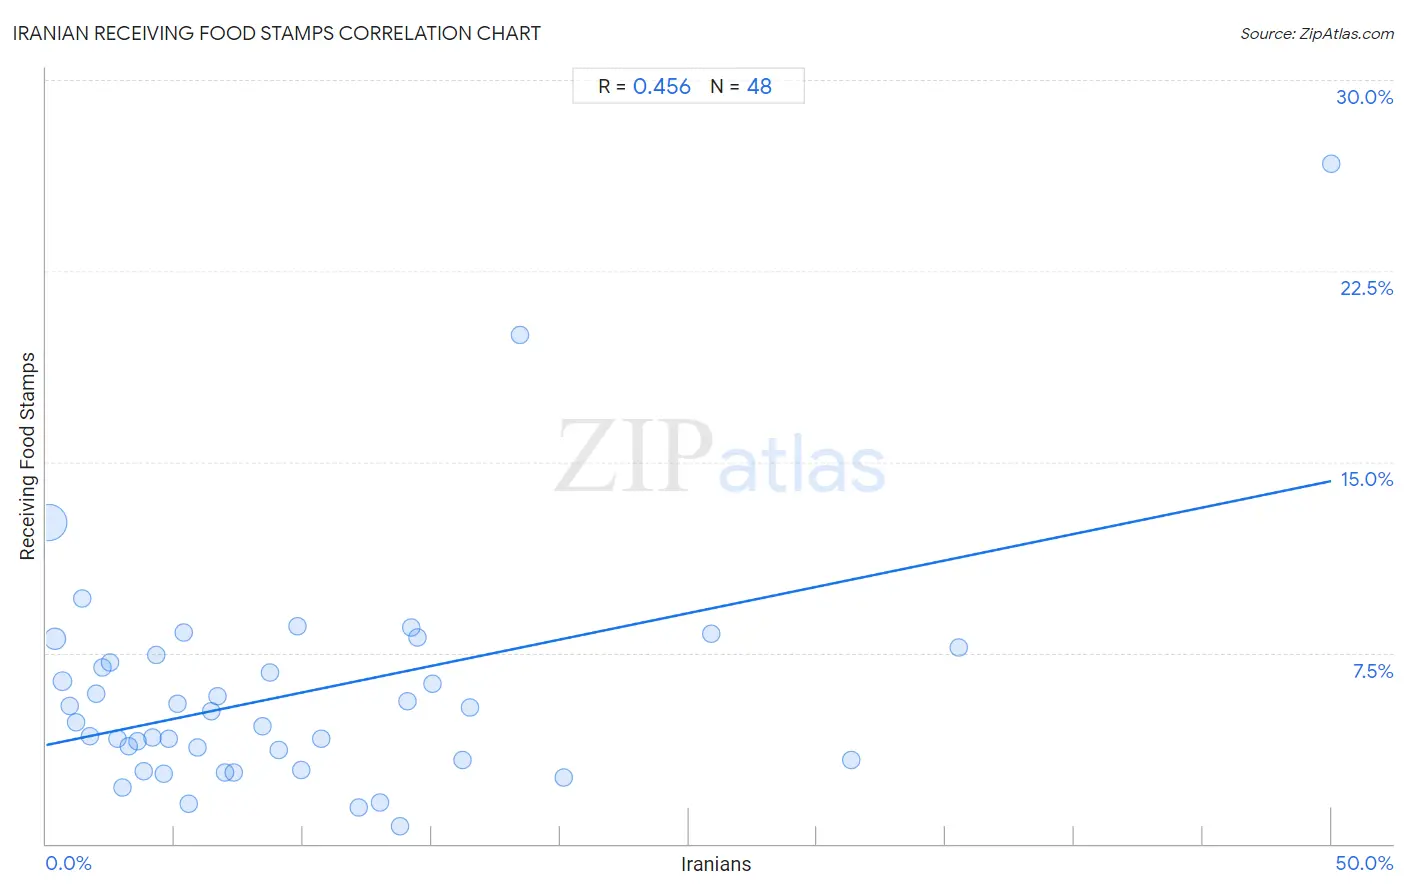
Iranian Receiving Food Stamps Correlation Chart
The statistical analysis conducted on geographies consisting of 315,912,646 people shows a moderate positive correlation between the proportion of Iranians and percentage of population receiving government assistance and/or food stamps in the United States with a correlation coefficient (R) of 0.456 and weighted average of 7.9%. On average, for every 1% (one percent) increase in Iranians within a typical geography, there is an increase of 0.21% in percentage of population receiving government assistance and/or food stamps.
It is essential to understand that the correlation between the percentage of Iranians and percentage of population receiving government assistance and/or food stamps does not imply a direct cause-and-effect relationship. It remains uncertain whether the presence of Iranians influences an upward or downward trend in the level of percentage of population receiving government assistance and/or food stamps within an area, or if Iranians simply ended up residing in those areas with higher or lower levels of percentage of population receiving government assistance and/or food stamps due to other factors.
Demographics Similar to Iranians by Receiving Food Stamps
In terms of receiving food stamps, the demographic groups most similar to Iranians are Thai (8.1%, a difference of 2.3%), Immigrants from Singapore (8.3%, a difference of 4.6%), Immigrants from Iran (8.3%, a difference of 5.2%), Filipino (7.4%, a difference of 7.3%), and Immigrants from India (7.4%, a difference of 7.6%).
| Demographics | Rating | Rank | Receiving Food Stamps |
| Immigrants from Taiwan | 100.0 /100 | #1 | Exceptional 7.3% |
| Immigrants from India | 100.0 /100 | #2 | Exceptional 7.4% |
| Filipinos | 100.0 /100 | #3 | Exceptional 7.4% |
| Iranians | 100.0 /100 | #4 | Exceptional 7.9% |
| Thais | 100.0 /100 | #5 | Exceptional 8.1% |
| Immigrants from Singapore | 100.0 /100 | #6 | Exceptional 8.3% |
| Immigrants from Iran | 100.0 /100 | #7 | Exceptional 8.3% |
| Burmese | 99.9 /100 | #8 | Exceptional 8.6% |
| Immigrants from Korea | 99.9 /100 | #9 | Exceptional 8.7% |
| Immigrants from South Central Asia | 99.9 /100 | #10 | Exceptional 8.8% |
| Okinawans | 99.9 /100 | #11 | Exceptional 8.9% |
| Cypriots | 99.9 /100 | #12 | Exceptional 8.9% |
| Bulgarians | 99.9 /100 | #13 | Exceptional 8.9% |
| Maltese | 99.9 /100 | #14 | Exceptional 8.9% |
| Norwegians | 99.9 /100 | #15 | Exceptional 9.0% |
Iranian Receiving Food Stamps Correlation Summary
| Measurement | Iranian Data | Receiving Food Stamps Data |
| Minimum | 0.097% | 0.70% |
| Maximum | 50.0% | 26.7% |
| Range | 49.9% | 26.0% |
| Mean | 9.7% | 5.9% |
| Median | 6.6% | 5.0% |
| Interquartile 25% (IQ1) | 3.1% | 3.3% |
| Interquartile 75% (IQ3) | 13.9% | 7.3% |
| Interquartile Range (IQR) | 10.8% | 4.0% |
| Standard Deviation (Sample) | 9.8% | 4.5% |
| Standard Deviation (Population) | 9.7% | 4.4% |
Correlation Details
| Iranian Percentile | Sample Size | Receiving Food Stamps |
[ 0.0% - 0.5% ] 0.097% | 228,490,122 | 12.6% |
[ 0.0% - 0.5% ] 0.36% | 45,564,062 | 8.1% |
[ 0.5% - 1.0% ] 0.63% | 16,882,833 | 6.4% |
[ 0.5% - 1.0% ] 0.91% | 7,290,355 | 5.4% |
[ 1.0% - 1.5% ] 1.17% | 4,420,216 | 4.8% |
[ 1.0% - 1.5% ] 1.39% | 6,237,604 | 9.6% |
[ 1.5% - 2.0% ] 1.69% | 1,852,787 | 4.2% |
[ 1.5% - 2.0% ] 1.93% | 896,805 | 5.9% |
[ 2.0% - 2.5% ] 2.20% | 702,408 | 6.9% |
[ 2.0% - 2.5% ] 2.47% | 552,384 | 7.1% |
[ 2.5% - 3.0% ] 2.79% | 556,336 | 4.1% |
[ 2.5% - 3.0% ] 2.95% | 241,999 | 2.2% |
[ 3.0% - 3.5% ] 3.22% | 271,339 | 3.8% |
[ 3.5% - 4.0% ] 3.53% | 596,243 | 4.0% |
[ 3.5% - 4.0% ] 3.82% | 256,178 | 2.9% |
[ 4.0% - 4.5% ] 4.13% | 73,451 | 4.2% |
[ 4.0% - 4.5% ] 4.29% | 94,015 | 7.4% |
[ 4.5% - 5.0% ] 4.59% | 80,023 | 2.8% |
[ 4.5% - 5.0% ] 4.77% | 175,449 | 4.1% |
[ 5.0% - 5.5% ] 5.12% | 6,092 | 5.5% |
[ 5.0% - 5.5% ] 5.37% | 9,676 | 8.3% |
[ 5.5% - 6.0% ] 5.54% | 23,987 | 1.6% |
[ 5.5% - 6.0% ] 5.89% | 82,117 | 3.8% |
[ 6.0% - 6.5% ] 6.44% | 70,131 | 5.2% |
[ 6.5% - 7.0% ] 6.68% | 67,510 | 5.8% |
[ 6.5% - 7.0% ] 6.95% | 31,515 | 2.8% |
[ 7.0% - 7.5% ] 7.27% | 26,318 | 2.8% |
[ 8.0% - 8.5% ] 8.41% | 51,872 | 4.6% |
[ 8.5% - 9.0% ] 8.72% | 64,485 | 6.7% |
[ 9.0% - 9.5% ] 9.06% | 50,392 | 3.7% |
[ 9.5% - 10.0% ] 9.77% | 37,705 | 8.5% |
[ 9.5% - 10.0% ] 9.92% | 23,106 | 2.9% |
[ 10.5% - 11.0% ] 10.72% | 9,169 | 4.1% |
[ 12.0% - 12.5% ] 12.16% | 2,936 | 1.4% |
[ 12.5% - 13.0% ] 12.98% | 7,868 | 1.6% |
[ 13.5% - 14.0% ] 13.77% | 1,445 | 0.70% |
[ 14.0% - 14.5% ] 14.05% | 10,881 | 5.6% |
[ 14.0% - 14.5% ] 14.21% | 366 | 8.5% |
[ 14.0% - 14.5% ] 14.47% | 9,699 | 8.1% |
[ 15.0% - 15.5% ] 15.02% | 11,060 | 6.3% |
[ 16.0% - 16.5% ] 16.20% | 16,190 | 3.3% |
[ 16.5% - 17.0% ] 16.51% | 32,963 | 5.3% |
[ 18.0% - 18.5% ] 18.45% | 233 | 20.0% |
[ 20.0% - 20.5% ] 20.15% | 19,180 | 2.6% |
[ 25.5% - 26.0% ] 25.85% | 1,350 | 8.2% |
[ 31.0% - 31.5% ] 31.30% | 9,105 | 3.3% |
[ 35.5% - 36.0% ] 35.51% | 642 | 7.7% |
[ 50.0% - 50.5% ] 50.00% | 44 | 26.7% |