Iranian College, Under 1 year

COMPARE

Iranian
Race
Ancestry
AfghanAfricanAlaska NativeAlaskan AthabascanAlbanianAleutAlsatianAmericanApacheArabArapahoArgentineanArmenianAssyrian/Chaldean/SyriacAustralianAustrianBahamianBangladeshiBarbadianBasqueBelgianBelizeanBermudanBhutaneseBlackfeetBolivianBrazilianBritishBritish West IndianBulgarianBurmeseCajunCambodianCanadianCape VerdeanCarpatho RusynCelticCentral AmericanCentral American IndianCherokeeCheyenneChickasawChileanChineseChippewaChoctawColombianColvilleComancheCosta RicanCreeCreekCroatianCrowCubanCypriotCzechCzechoslovakianDanishDelawareDominicanDutchDutch West IndianEastern EuropeanEcuadorianEgyptianEnglishEstonianEthiopianEuropeanFijianFilipinoFinnishFrenchFrench American IndianFrench CanadianGermanGerman RussianGhanaianGreekGuamanian/ChamorroGuatemalanGuyaneseHaitianHmongHonduranHopiHoumaHungarianIcelanderIndian (Asian)IndonesianInupiatIranianIraqiIrishIroquoisIsraeliItalianJamaicanJapaneseJordanianKenyanKiowaKoreanLaotianLatvianLebaneseLiberianLithuanianLumbeeLuxembourgerMacedonianMalaysianMalteseMarshalleseMenomineeMexicanMexican American IndianMongolianMoroccanNative HawaiianNavajoNepaleseNew ZealanderNicaraguanNigerianNorthern EuropeanNorwegianOkinawanOsageOttawaPaiutePakistaniPalestinianPanamanianParaguayanPennsylvania GermanPeruvianPimaPolishPortuguesePotawatomiPuebloPuerto RicanPuget Sound SalishRomanianRussianSalvadoranSamoanScandinavianScotch-IrishScottishSeminoleSenegaleseSerbianShoshoneSierra LeoneanSiouxSlavicSlovakSloveneSomaliSouth AfricanSouth AmericanSouth American IndianSoviet UnionSpaniardSpanishSpanish AmericanSpanish American IndianSri LankanSubsaharan AfricanSudaneseSwedishSwissSyrianTaiwaneseThaiTlingit-HaidaTohono O'OdhamTonganTrinidadian and TobagonianTsimshianTurkishU.S. Virgin IslanderUgandanUkrainianUruguayanUteVenezuelanVietnameseWelshWest IndianYakamaYaquiYugoslavianYumanYup'ikZimbabwean
Immigration
NonimmigrantsImmigrantsAfghanistanAfricaAlbaniaArgentinaArmeniaAsiaAustraliaAustriaBahamasBangladeshBarbadosBelarusBelgiumBelizeBoliviaBosnia and HerzegovinaBrazilBulgariaBurma/MyanmarCabo VerdeCambodiaCameroonCanadaCaribbeanCentral AmericaChileChinaColombiaCongoCosta RicaCroatiaCubaCzechoslovakiaDenmarkDominicaDominican RepublicEastern AfricaEastern AsiaEastern EuropeEcuadorEgyptEl SalvadorEnglandEritreaEthiopiaEuropeFijiFranceGermanyGhanaGreeceGrenadaGuatemalaGuyanaHaitiHondurasHong KongHungaryIndiaIndonesiaIranIraqIrelandIsraelItalyJamaicaJapanJordanKazakhstanKenyaKoreaKuwaitLaosLatin AmericaLatviaLebanonLiberiaLithuaniaMalaysiaMexicoMicronesiaMiddle AfricaMoldovaMoroccoNepalNetherlandsNicaraguaNigeriaNorth AmericaNorth MacedoniaNorthern AfricaNorthern EuropeNorwayOceaniaPakistanPanamaPeruPhilippinesPolandPortugalRomaniaRussiaSaudi ArabiaScotlandSenegalSerbiaSierra LeoneSingaporeSomaliaSouth AfricaSouth AmericaSouth Central AsiaSouth Eastern AsiaSouthern EuropeSpainSri LankaSt. Vincent and the GrenadinesSudanSwedenSwitzerlandSyriaTaiwanThailandTrinidad and TobagoTurkeyUgandaUkraineUruguayUzbekistanVenezuelaVietnamWest IndiesWestern AfricaWestern AsiaWestern EuropeYemenZaireZimbabweAzores
Select to Compare
Race
Ancestry
AfghanAfricanAlaska NativeAlaskan AthabascanAlbanianAleutAlsatianAmericanApacheArabArapahoArgentineanArmenianAssyrian/Chaldean/SyriacAustralianAustrianBahamianBangladeshiBarbadianBasqueBelgianBelizeanBermudanBhutaneseBlackfeetBolivianBrazilianBritishBritish West IndianBulgarianBurmeseCajunCambodianCanadianCape VerdeanCarpatho RusynCelticCentral AmericanCentral American IndianCherokeeCheyenneChickasawChileanChineseChippewaChoctawColombianColvilleComancheCosta RicanCreeCreekCroatianCrowCubanCypriotCzechCzechoslovakianDanishDelawareDominicanDutchDutch West IndianEastern EuropeanEcuadorianEgyptianEnglishEstonianEthiopianEuropeanFijianFilipinoFinnishFrenchFrench American IndianFrench CanadianGermanGerman RussianGhanaianGreekGuamanian/ChamorroGuatemalanGuyaneseHaitianHmongHonduranHopiHoumaHungarianIcelanderIndian (Asian)IndonesianInupiatIraqiIrishIroquoisIsraeliItalianJamaicanJapaneseJordanianKenyanKiowaKoreanLaotianLatvianLebaneseLiberianLithuanianLumbeeLuxembourgerMacedonianMalaysianMalteseMarshalleseMenomineeMexicanMexican American IndianMongolianMoroccanNative HawaiianNavajoNepaleseNew ZealanderNicaraguanNigerianNorthern EuropeanNorwegianOkinawanOsageOttawaPaiutePakistaniPalestinianPanamanianParaguayanPennsylvania GermanPeruvianPimaPolishPortuguesePotawatomiPuebloPuerto RicanPuget Sound SalishRomanianRussianSalvadoranSamoanScandinavianScotch-IrishScottishSeminoleSenegaleseSerbianShoshoneSierra LeoneanSiouxSlavicSlovakSloveneSomaliSouth AfricanSouth AmericanSouth American IndianSoviet UnionSpaniardSpanishSpanish AmericanSpanish American IndianSri LankanSubsaharan AfricanSudaneseSwedishSwissSyrianTaiwaneseThaiTlingit-HaidaTohono O'OdhamTonganTrinidadian and TobagonianTsimshianTurkishU.S. Virgin IslanderUgandanUkrainianUruguayanUteVenezuelanVietnameseWelshWest IndianYakamaYaquiYugoslavianYumanYup'ikZimbabwean
Immigration
NonimmigrantsImmigrantsAfghanistanAfricaAlbaniaArgentinaArmeniaAsiaAustraliaAustriaBahamasBangladeshBarbadosBelarusBelgiumBelizeBoliviaBosnia and HerzegovinaBrazilBulgariaBurma/MyanmarCabo VerdeCambodiaCameroonCanadaCaribbeanCentral AmericaChileChinaColombiaCongoCosta RicaCroatiaCubaCzechoslovakiaDenmarkDominicaDominican RepublicEastern AfricaEastern AsiaEastern EuropeEcuadorEgyptEl SalvadorEnglandEritreaEthiopiaEuropeFijiFranceGermanyGhanaGreeceGrenadaGuatemalaGuyanaHaitiHondurasHong KongHungaryIndiaIndonesiaIranIraqIrelandIsraelItalyJamaicaJapanJordanKazakhstanKenyaKoreaKuwaitLaosLatin AmericaLatviaLebanonLiberiaLithuaniaMalaysiaMexicoMicronesiaMiddle AfricaMoldovaMoroccoNepalNetherlandsNicaraguaNigeriaNorth AmericaNorth MacedoniaNorthern AfricaNorthern EuropeNorwayOceaniaPakistanPanamaPeruPhilippinesPolandPortugalRomaniaRussiaSaudi ArabiaScotlandSenegalSerbiaSierra LeoneSingaporeSomaliaSouth AfricaSouth AmericaSouth Central AsiaSouth Eastern AsiaSouthern EuropeSpainSri LankaSt. Vincent and the GrenadinesSudanSwedenSwitzerlandSyriaTaiwanThailandTrinidad and TobagoTurkeyUgandaUkraineUruguayUzbekistanVenezuelaVietnamWest IndiesWestern AfricaWestern AsiaWestern EuropeYemenZaireZimbabweAzores
College, Under 1 year
Income
Poverty
Unemployment
Labor Participation
Family Structure
Vehicle Availability
Education Level
Disability

Iranian College, Under 1 year
Exceptional

74.9%
COLLEGE, UNDER 1 YEAR
100.0/ 100
METRIC RATING
2nd/ 347
METRIC RANK

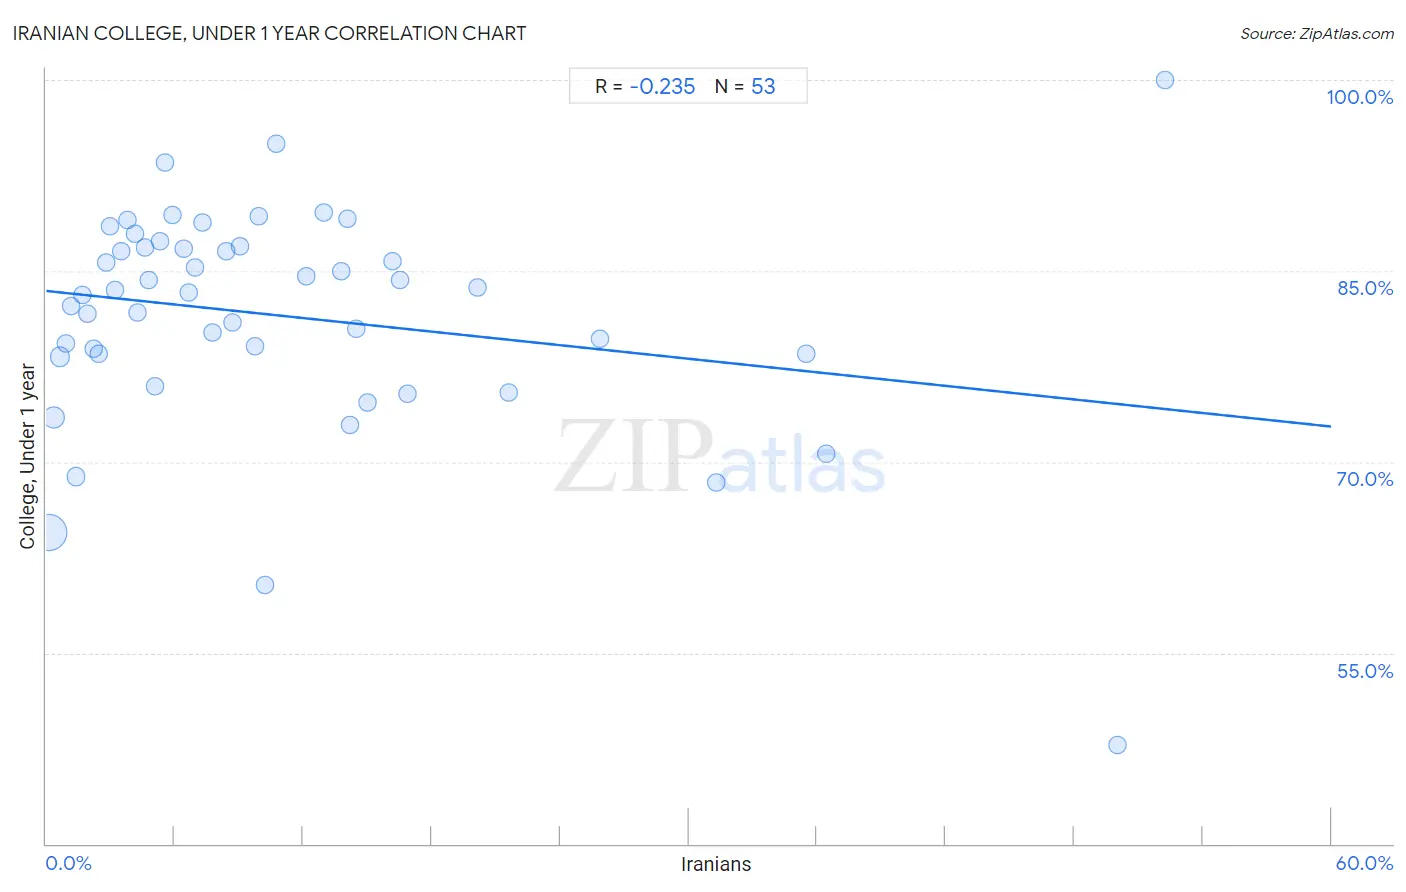
Iranian College, Under 1 year Correlation Chart

The statistical analysis conducted on geographies consisting of 316,900,663 people shows a weak negative correlation between the proportion of Iranians and percentage of population with at least college, under 1 year education in the United States with a correlation coefficient (R) of -0.235 and weighted average of 74.9%. On average, for every 1% (one percent) increase in Iranians within a typical geography, there is a decrease of 0.18% in percentage of population with at least college, under 1 year education.
Iranian College, Under 1 year
It is essential to understand that the correlation between the percentage of Iranians and percentage of population with at least college, under 1 year education does not imply a direct cause-and-effect relationship. It remains uncertain whether the presence of Iranians influences an upward or downward trend in the level of percentage of population with at least college, under 1 year education within an area, or if Iranians simply ended up residing in those areas with higher or lower levels of percentage of population with at least college, under 1 year education due to other factors.

Demographics Similar to Iranians by College, Under 1 year

In terms of college, under 1 year, the demographic groups most similar to Iranians are Immigrants from Singapore (74.8%, a difference of 0.050%), Immigrants from India (74.4%, a difference of 0.56%), Immigrants from Iran (74.3%, a difference of 0.79%), Filipino (75.5%, a difference of 0.85%), and Immigrants from Taiwan (74.2%, a difference of 0.90%).
DemographicsRating | RankCollege, Under 1 year
Filipinos
100.0
/100
|
#1
Exceptional
75.5%
Iranians
100.0
/100
|
#2
Exceptional
74.9%
Immigrants from Singapore
100.0
/100
|
#3
Exceptional
74.8%
Immigrants from India
100.0
/100
|
#4
Exceptional
74.4%
Immigrants from Iran
100.0
/100
|
#5
Exceptional
74.3%
Immigrants from Taiwan
100.0
/100
|
#6
Exceptional
74.2%
Okinawans
100.0
/100
|
#7
Exceptional
73.7%
Thais
100.0
/100
|
#8
Exceptional
73.4%
Immigrants from Australia
100.0
/100
|
#9
Exceptional
72.7%
Immigrants from Israel
100.0
/100
|
#10
Exceptional
72.3%
Immigrants from South Central Asia
100.0
/100
|
#11
Exceptional
72.1%
Immigrants from Sweden
100.0
/100
|
#12
Exceptional
72.1%
Cypriots
100.0
/100
|
#13
Exceptional
72.0%
Cambodians
100.0
/100
|
#14
Exceptional
71.9%
Burmese
100.0
/100
|
#15
Exceptional
71.9%

Iranian College, Under 1 year Correlation Summary

MeasurementIranian DataCollege, Under 1 year Data
Minimum0.097%47.7%
Maximum52.2%100.0%
Range52.1%52.3%
Mean11.1%81.5%
Median7.3%83.3%
Interquartile 25% (IQ1)3.4%78.4%
Interquartile 75% (IQ3)14.3%86.9%
Interquartile Range (IQR)11.0%8.5%
Standard Deviation (Sample)11.7%8.8%
Standard Deviation (Population)11.6%8.8%

Correlation Details

Iranian PercentileSample SizeCollege, Under 1 year
[
0.0%
-
0.5%
]
0.097%
228,889,88764.4%
[
0.0%
-
0.5%
]
0.36%
45,819,10073.5%
[
0.5%
-
1.0%
]
0.63%
16,974,04478.3%
[
0.5%
-
1.0%
]
0.91%
7,337,85879.3%
[
1.0%
-
1.5%
]
1.17%
4,475,42982.2%
[
1.0%
-
1.5%
]
1.39%
6,266,45668.8%
[
1.5%
-
2.0%
]
1.69%
1,882,53583.1%
[
1.5%
-
2.0%
]
1.93%
913,16881.7%
[
2.0%
-
2.5%
]
2.20%
716,55978.9%
[
2.0%
-
2.5%
]
2.47%
562,32078.5%
[
2.5%
-
3.0%
]
2.79%
556,80385.6%
[
2.5%
-
3.0%
]
2.95%
246,19288.5%
[
3.0%
-
3.5%
]
3.22%
274,43983.5%
[
3.5%
-
4.0%
]
3.53%
597,93586.5%
[
3.5%
-
4.0%
]
3.82%
257,34989.0%
[
4.0%
-
4.5%
]
4.13%
74,77387.9%
[
4.0%
-
4.5%
]
4.29%
95,98981.7%
[
4.5%
-
5.0%
]
4.59%
81,13186.8%
[
4.5%
-
5.0%
]
4.77%
175,71384.3%
[
5.0%
-
5.5%
]
5.11%
8,20575.9%
[
5.0%
-
5.5%
]
5.34%
13,17587.4%
[
5.5%
-
6.0%
]
5.54%
24,16793.5%
[
5.5%
-
6.0%
]
5.89%
82,11789.4%
[
6.0%
-
6.5%
]
6.44%
71,12986.8%
[
6.5%
-
7.0%
]
6.68%
69,27883.3%
[
6.5%
-
7.0%
]
6.94%
35,33385.2%
[
7.0%
-
7.5%
]
7.27%
26,31888.8%
[
7.5%
-
8.0%
]
7.74%
34980.1%
[
8.0%
-
8.5%
]
8.41%
52,74186.6%
[
8.5%
-
9.0%
]
8.72%
64,48581.0%
[
9.0%
-
9.5%
]
9.06%
50,39287.0%
[
9.5%
-
10.0%
]
9.77%
37,70579.1%
[
9.5%
-
10.0%
]
9.92%
23,66989.3%
[
10.0%
-
10.5%
]
10.23%
57760.4%
[
10.5%
-
11.0%
]
10.72%
9,16995.0%
[
12.0%
-
12.5%
]
12.13%
5,58984.6%
[
12.5%
-
13.0%
]
12.98%
7,86889.6%
[
13.5%
-
14.0%
]
13.77%
1,44585.0%
[
14.0%
-
14.5%
]
14.05%
11,28989.1%
[
14.0%
-
14.5%
]
14.21%
36672.9%
[
14.0%
-
14.5%
]
14.47%
9,69980.5%
[
15.0%
-
15.5%
]
15.02%
11,06074.7%
[
16.0%
-
16.5%
]
16.20%
16,65285.7%
[
16.5%
-
17.0%
]
16.51%
32,96384.3%
[
16.5%
-
17.0%
]
16.88%
7775.3%
[
20.0%
-
20.5%
]
20.15%
19,18083.7%
[
21.5%
-
22.0%
]
21.60%
1,13975.5%
[
25.5%
-
26.0%
]
25.85%
1,35079.7%
[
31.0%
-
31.5%
]
31.30%
9,10568.4%
[
35.5%
-
36.0%
]
35.51%
64278.5%
[
36.0%
-
36.5%
]
36.42%
5,59370.6%
[
50.0%
-
50.5%
]
50.00%
4447.7%
[
52.0%
-
52.5%
]
52.21%
113100.0%