Immigrants from Western Europe Married-couple Households

COMPARE

Immigrants from Western Europe
Race
Ancestry
AfghanAfricanAlaska NativeAlaskan AthabascanAlbanianAleutAlsatianAmericanApacheArabArapahoArgentineanArmenianAssyrian/Chaldean/SyriacAustralianAustrianBahamianBangladeshiBarbadianBasqueBelgianBelizeanBermudanBhutaneseBlackfeetBolivianBrazilianBritishBritish West IndianBulgarianBurmeseCajunCambodianCanadianCape VerdeanCarpatho RusynCelticCentral AmericanCentral American IndianCherokeeCheyenneChickasawChileanChineseChippewaChoctawColombianColvilleComancheCosta RicanCreeCreekCroatianCrowCubanCypriotCzechCzechoslovakianDanishDelawareDominicanDutchDutch West IndianEastern EuropeanEcuadorianEgyptianEnglishEstonianEthiopianEuropeanFijianFilipinoFinnishFrenchFrench American IndianFrench CanadianGermanGerman RussianGhanaianGreekGuamanian/ChamorroGuatemalanGuyaneseHaitianHmongHonduranHopiHoumaHungarianIcelanderIndian (Asian)IndonesianInupiatIranianIraqiIrishIroquoisIsraeliItalianJamaicanJapaneseJordanianKenyanKiowaKoreanLaotianLatvianLebaneseLiberianLithuanianLumbeeLuxembourgerMacedonianMalaysianMalteseMarshalleseMenomineeMexicanMexican American IndianMongolianMoroccanNative HawaiianNavajoNepaleseNew ZealanderNicaraguanNigerianNorthern EuropeanNorwegianOkinawanOsageOttawaPaiutePakistaniPalestinianPanamanianParaguayanPennsylvania GermanPeruvianPimaPolishPortuguesePotawatomiPuebloPuerto RicanPuget Sound SalishRomanianRussianSalvadoranSamoanScandinavianScotch-IrishScottishSeminoleSenegaleseSerbianShoshoneSierra LeoneanSiouxSlavicSlovakSloveneSomaliSouth AfricanSouth AmericanSouth American IndianSoviet UnionSpaniardSpanishSpanish AmericanSpanish American IndianSri LankanSubsaharan AfricanSudaneseSwedishSwissSyrianTaiwaneseThaiTlingit-HaidaTohono O'OdhamTonganTrinidadian and TobagonianTsimshianTurkishU.S. Virgin IslanderUgandanUkrainianUruguayanUteVenezuelanVietnameseWelshWest IndianYakamaYaquiYugoslavianYumanYup'ikZimbabwean
Immigration
NonimmigrantsImmigrantsAfghanistanAfricaAlbaniaArgentinaArmeniaAsiaAustraliaAustriaBahamasBangladeshBarbadosBelarusBelgiumBelizeBoliviaBosnia and HerzegovinaBrazilBulgariaBurma/MyanmarCabo VerdeCambodiaCameroonCanadaCaribbeanCentral AmericaChileChinaColombiaCongoCosta RicaCroatiaCubaCzechoslovakiaDenmarkDominicaDominican RepublicEastern AfricaEastern AsiaEastern EuropeEcuadorEgyptEl SalvadorEnglandEritreaEthiopiaEuropeFijiFranceGermanyGhanaGreeceGrenadaGuatemalaGuyanaHaitiHondurasHong KongHungaryIndiaIndonesiaIranIraqIrelandIsraelItalyJamaicaJapanJordanKazakhstanKenyaKoreaKuwaitLaosLatin AmericaLatviaLebanonLiberiaLithuaniaMalaysiaMexicoMicronesiaMiddle AfricaMoldovaMoroccoNepalNetherlandsNicaraguaNigeriaNorth AmericaNorth MacedoniaNorthern AfricaNorthern EuropeNorwayOceaniaPakistanPanamaPeruPhilippinesPolandPortugalRomaniaRussiaSaudi ArabiaScotlandSenegalSerbiaSierra LeoneSingaporeSomaliaSouth AfricaSouth AmericaSouth Central AsiaSouth Eastern AsiaSouthern EuropeSpainSri LankaSt. Vincent and the GrenadinesSudanSwedenSwitzerlandSyriaTaiwanThailandTrinidad and TobagoTurkeyUgandaUkraineUruguayUzbekistanVenezuelaVietnamWest IndiesWestern AfricaWestern AsiaWestern EuropeYemenZaireZimbabweAzores
Select to Compare
Race
Ancestry
AfghanAfricanAlaska NativeAlaskan AthabascanAlbanianAleutAlsatianAmericanApacheArabArapahoArgentineanArmenianAssyrian/Chaldean/SyriacAustralianAustrianBahamianBangladeshiBarbadianBasqueBelgianBelizeanBermudanBhutaneseBlackfeetBolivianBrazilianBritishBritish West IndianBulgarianBurmeseCajunCambodianCanadianCape VerdeanCarpatho RusynCelticCentral AmericanCentral American IndianCherokeeCheyenneChickasawChileanChineseChippewaChoctawColombianColvilleComancheCosta RicanCreeCreekCroatianCrowCubanCypriotCzechCzechoslovakianDanishDelawareDominicanDutchDutch West IndianEastern EuropeanEcuadorianEgyptianEnglishEstonianEthiopianEuropeanFijianFilipinoFinnishFrenchFrench American IndianFrench CanadianGermanGerman RussianGhanaianGreekGuamanian/ChamorroGuatemalanGuyaneseHaitianHmongHonduranHopiHoumaHungarianIcelanderIndian (Asian)IndonesianInupiatIranianIraqiIrishIroquoisIsraeliItalianJamaicanJapaneseJordanianKenyanKiowaKoreanLaotianLatvianLebaneseLiberianLithuanianLumbeeLuxembourgerMacedonianMalaysianMalteseMarshalleseMenomineeMexicanMexican American IndianMongolianMoroccanNative HawaiianNavajoNepaleseNew ZealanderNicaraguanNigerianNorthern EuropeanNorwegianOkinawanOsageOttawaPaiutePakistaniPalestinianPanamanianParaguayanPennsylvania GermanPeruvianPimaPolishPortuguesePotawatomiPuebloPuerto RicanPuget Sound SalishRomanianRussianSalvadoranSamoanScandinavianScotch-IrishScottishSeminoleSenegaleseSerbianShoshoneSierra LeoneanSiouxSlavicSlovakSloveneSomaliSouth AfricanSouth AmericanSouth American IndianSoviet UnionSpaniardSpanishSpanish AmericanSpanish American IndianSri LankanSubsaharan AfricanSudaneseSwedishSwissSyrianTaiwaneseThaiTlingit-HaidaTohono O'OdhamTonganTrinidadian and TobagonianTsimshianTurkishU.S. Virgin IslanderUgandanUkrainianUruguayanUteVenezuelanVietnameseWelshWest IndianYakamaYaquiYugoslavianYumanYup'ikZimbabwean
Immigration
NonimmigrantsImmigrantsAfghanistanAfricaAlbaniaArgentinaArmeniaAsiaAustraliaAustriaBahamasBangladeshBarbadosBelarusBelgiumBelizeBoliviaBosnia and HerzegovinaBrazilBulgariaBurma/MyanmarCabo VerdeCambodiaCameroonCanadaCaribbeanCentral AmericaChileChinaColombiaCongoCosta RicaCroatiaCubaCzechoslovakiaDenmarkDominicaDominican RepublicEastern AfricaEastern AsiaEastern EuropeEcuadorEgyptEl SalvadorEnglandEritreaEthiopiaEuropeFijiFranceGermanyGhanaGreeceGrenadaGuatemalaGuyanaHaitiHondurasHong KongHungaryIndiaIndonesiaIranIraqIrelandIsraelItalyJamaicaJapanJordanKazakhstanKenyaKoreaKuwaitLaosLatin AmericaLatviaLebanonLiberiaLithuaniaMalaysiaMexicoMicronesiaMiddle AfricaMoldovaMoroccoNepalNetherlandsNicaraguaNigeriaNorth AmericaNorth MacedoniaNorthern AfricaNorthern EuropeNorwayOceaniaPakistanPanamaPeruPhilippinesPolandPortugalRomaniaRussiaSaudi ArabiaScotlandSenegalSerbiaSierra LeoneSingaporeSomaliaSouth AfricaSouth AmericaSouth Central AsiaSouth Eastern AsiaSouthern EuropeSpainSri LankaSt. Vincent and the GrenadinesSudanSwedenSwitzerlandSyriaTaiwanThailandTrinidad and TobagoTurkeyUgandaUkraineUruguayUzbekistanVenezuelaVietnamWest IndiesWestern AfricaWestern AsiaYemenZaireZimbabweAzores
Married-couple Households
Income
Poverty
Unemployment
Labor Participation
Family Structure
Vehicle Availability
Education Level
Disability

Immigrants from Western Europe Married-couple Households
Excellent

47.1%
MARRIED-COUPLE HOUSEHOLDS
81.6/ 100
METRIC RATING
146th/ 347
METRIC RANK

Immigrants from Western Europe Married-couple Households Correlation Chart

The statistical analysis conducted on geographies consisting of 493,807,996 people shows a substantial positive correlation between the proportion of Immigrants from Western Europe and percentage of married-couple family households in the United States with a correlation coefficient (R) of 0.593 and weighted average of 47.1%. On average, for every 1% (one percent) increase in Immigrants from Western Europe within a typical geography, there is an increase of 0.54% in percentage of married-couple family households.
Immigrants from Western Europe Married-couple Households
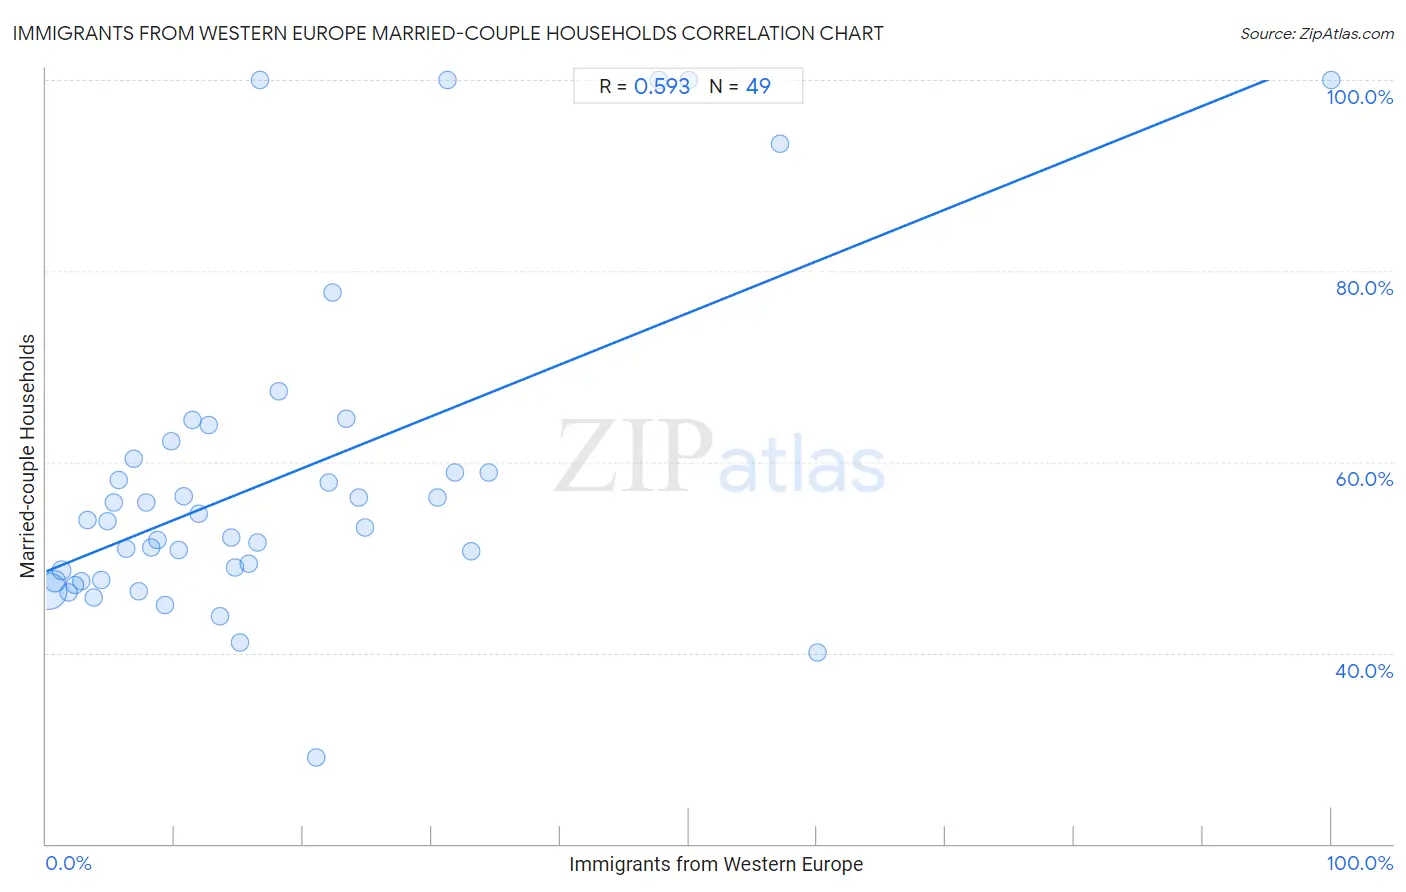
It is essential to understand that the correlation between the percentage of Immigrants from Western Europe and percentage of married-couple family households does not imply a direct cause-and-effect relationship. It remains uncertain whether the presence of Immigrants from Western Europe influences an upward or downward trend in the level of percentage of married-couple family households within an area, or if Immigrants from Western Europe simply ended up residing in those areas with higher or lower levels of percentage of married-couple family households due to other factors.

Demographics Similar to Immigrants from Western Europe by Married-couple Households

In terms of married-couple households, the demographic groups most similar to Immigrants from Western Europe are Slovene (47.1%, a difference of 0.0%), Immigrants from Syria (47.1%, a difference of 0.0%), Mexican (47.1%, a difference of 0.12%), Icelander (47.0%, a difference of 0.13%), and Immigrants from Belarus (47.2%, a difference of 0.14%).
DemographicsRating | RankMarried-couple Households
Immigrants from Sweden
84.7
/100
|
#139
Excellent
47.2%
Spanish
84.5
/100
|
#140
Excellent
47.2%
Costa Ricans
84.4
/100
|
#141
Excellent
47.2%
Spaniards
84.1
/100
|
#142
Excellent
47.2%
Immigrants from Belarus
83.8
/100
|
#143
Excellent
47.2%
Mexicans
83.4
/100
|
#144
Excellent
47.1%
Slovenes
81.7
/100
|
#145
Excellent
47.1%
Immigrants from Western Europe
81.6
/100
|
#146
Excellent
47.1%
Immigrants from Syria
81.6
/100
|
#147
Excellent
47.1%
Icelanders
79.5
/100
|
#148
Good
47.0%
Paraguayans
78.7
/100
|
#149
Good
47.0%
Immigrants from Russia
77.6
/100
|
#150
Good
47.0%
Immigrants from Bulgaria
76.8
/100
|
#151
Good
47.0%
Serbians
76.3
/100
|
#152
Good
47.0%
Hmong
76.2
/100
|
#153
Good
47.0%

Immigrants from Western Europe Married-couple Households Correlation Summary

MeasurementImmigrants from Western Europe DataMarried-couple Households Data
Minimum0.21%29.0%
Maximum100.0%100.0%
Range99.8%71.0%
Mean18.3%58.4%
Median12.6%53.7%
Interquartile 25% (IQ1)6.0%47.6%
Interquartile 75% (IQ3)23.8%61.3%
Interquartile Range (IQR)17.9%13.7%
Standard Deviation (Sample)18.8%17.2%
Standard Deviation (Population)18.6%17.0%

Correlation Details

Immigrants from Western Europe PercentileSample SizeMarried-couple Households
[
0.0%
-
0.5%
]
0.21%
395,814,27846.5%
[
0.5%
-
1.0%
]
0.66%
77,219,71647.4%
[
1.0%
-
1.5%
]
1.19%
13,239,30448.6%
[
1.5%
-
2.0%
]
1.71%
4,216,74646.3%
[
2.0%
-
2.5%
]
2.20%
2,094,90247.1%
[
2.5%
-
3.0%
]
2.73%
642,44247.5%
[
3.0%
-
3.5%
]
3.25%
210,50953.9%
[
3.5%
-
4.0%
]
3.65%
141,43645.7%
[
4.0%
-
4.5%
]
4.25%
63,46147.7%
[
4.5%
-
5.0%
]
4.79%
40,10153.7%
[
5.0%
-
5.5%
]
5.30%
45,95955.8%
[
5.5%
-
6.0%
]
5.66%
11,27058.2%
[
6.0%
-
6.5%
]
6.25%
10,61650.9%
[
6.5%
-
7.0%
]
6.82%
4,64960.4%
[
7.0%
-
7.5%
]
7.18%
10,29346.4%
[
7.5%
-
8.0%
]
7.74%
9,55955.8%
[
8.0%
-
8.5%
]
8.17%
3,75851.0%
[
8.5%
-
9.0%
]
8.62%
9,10951.8%
[
9.0%
-
9.5%
]
9.23%
5,17945.0%
[
9.5%
-
10.0%
]
9.71%
3,97662.1%
[
10.0%
-
10.5%
]
10.29%
2,40050.8%
[
10.5%
-
11.0%
]
10.67%
90056.4%
[
11.0%
-
11.5%
]
11.34%
59164.4%
[
11.5%
-
12.0%
]
11.84%
15254.5%
[
12.5%
-
13.0%
]
12.61%
69063.9%
[
13.5%
-
14.0%
]
13.56%
11843.8%
[
14.0%
-
14.5%
]
14.35%
41852.1%
[
14.5%
-
15.0%
]
14.69%
17749.0%
[
15.0%
-
15.5%
]
15.04%
83841.1%
[
15.5%
-
16.0%
]
15.75%
27349.3%
[
16.0%
-
16.5%
]
16.47%
83251.6%
[
16.5%
-
17.0%
]
16.67%
144100.0%
[
18.0%
-
18.5%
]
18.12%
1,34167.5%
[
21.0%
-
21.5%
]
21.05%
9529.0%
[
21.5%
-
22.0%
]
21.98%
9157.9%
[
22.0%
-
22.5%
]
22.26%
27477.7%
[
23.0%
-
23.5%
]
23.35%
62164.6%
[
24.0%
-
24.5%
]
24.27%
10356.2%
[
24.5%
-
25.0%
]
24.78%
11353.1%
[
30.0%
-
30.5%
]
30.43%
4656.2%
[
31.0%
-
31.5%
]
31.25%
16100.0%
[
31.5%
-
32.0%
]
31.82%
4458.8%
[
33.0%
-
33.5%
]
33.10%
14250.6%
[
34.0%
-
34.5%
]
34.48%
5858.8%
[
47.5%
-
48.0%
]
47.69%
65100.0%
[
50.0%
-
50.5%
]
50.00%
12100.0%
[
57.0%
-
57.5%
]
57.14%
13393.3%
[
60.0%
-
60.5%
]
60.00%
2540.0%
[
99.5%
-
100.0%
]
100.00%
21100.0%