Immigrants from Western Europe 1 or more Vehicles in Household

COMPARE

Immigrants from Western Europe
Race
Ancestry
AfghanAfricanAlaska NativeAlaskan AthabascanAlbanianAleutAlsatianAmericanApacheArabArapahoArgentineanArmenianAssyrian/Chaldean/SyriacAustralianAustrianBahamianBangladeshiBarbadianBasqueBelgianBelizeanBermudanBhutaneseBlackfeetBolivianBrazilianBritishBritish West IndianBulgarianBurmeseCajunCambodianCanadianCape VerdeanCarpatho RusynCelticCentral AmericanCentral American IndianCherokeeCheyenneChickasawChileanChineseChippewaChoctawColombianColvilleComancheCosta RicanCreeCreekCroatianCrowCubanCypriotCzechCzechoslovakianDanishDelawareDominicanDutchDutch West IndianEastern EuropeanEcuadorianEgyptianEnglishEstonianEthiopianEuropeanFijianFilipinoFinnishFrenchFrench American IndianFrench CanadianGermanGerman RussianGhanaianGreekGuamanian/ChamorroGuatemalanGuyaneseHaitianHmongHonduranHopiHoumaHungarianIcelanderIndian (Asian)IndonesianInupiatIranianIraqiIrishIroquoisIsraeliItalianJamaicanJapaneseJordanianKenyanKiowaKoreanLaotianLatvianLebaneseLiberianLithuanianLumbeeLuxembourgerMacedonianMalaysianMalteseMarshalleseMenomineeMexicanMexican American IndianMongolianMoroccanNative HawaiianNavajoNepaleseNew ZealanderNicaraguanNigerianNorthern EuropeanNorwegianOkinawanOsageOttawaPaiutePakistaniPalestinianPanamanianParaguayanPennsylvania GermanPeruvianPimaPolishPortuguesePotawatomiPuebloPuerto RicanPuget Sound SalishRomanianRussianSalvadoranSamoanScandinavianScotch-IrishScottishSeminoleSenegaleseSerbianShoshoneSierra LeoneanSiouxSlavicSlovakSloveneSomaliSouth AfricanSouth AmericanSouth American IndianSoviet UnionSpaniardSpanishSpanish AmericanSpanish American IndianSri LankanSubsaharan AfricanSudaneseSwedishSwissSyrianTaiwaneseThaiTlingit-HaidaTohono O'OdhamTonganTrinidadian and TobagonianTsimshianTurkishU.S. Virgin IslanderUgandanUkrainianUruguayanUteVenezuelanVietnameseWelshWest IndianYakamaYaquiYugoslavianYumanYup'ikZimbabwean
Immigration
NonimmigrantsImmigrantsAfghanistanAfricaAlbaniaArgentinaArmeniaAsiaAustraliaAustriaBahamasBangladeshBarbadosBelarusBelgiumBelizeBoliviaBosnia and HerzegovinaBrazilBulgariaBurma/MyanmarCabo VerdeCambodiaCameroonCanadaCaribbeanCentral AmericaChileChinaColombiaCongoCosta RicaCroatiaCubaCzechoslovakiaDenmarkDominicaDominican RepublicEastern AfricaEastern AsiaEastern EuropeEcuadorEgyptEl SalvadorEnglandEritreaEthiopiaEuropeFijiFranceGermanyGhanaGreeceGrenadaGuatemalaGuyanaHaitiHondurasHong KongHungaryIndiaIndonesiaIranIraqIrelandIsraelItalyJamaicaJapanJordanKazakhstanKenyaKoreaKuwaitLaosLatin AmericaLatviaLebanonLiberiaLithuaniaMalaysiaMexicoMicronesiaMiddle AfricaMoldovaMoroccoNepalNetherlandsNicaraguaNigeriaNorth AmericaNorth MacedoniaNorthern AfricaNorthern EuropeNorwayOceaniaPakistanPanamaPeruPhilippinesPolandPortugalRomaniaRussiaSaudi ArabiaScotlandSenegalSerbiaSierra LeoneSingaporeSomaliaSouth AfricaSouth AmericaSouth Central AsiaSouth Eastern AsiaSouthern EuropeSpainSri LankaSt. Vincent and the GrenadinesSudanSwedenSwitzerlandSyriaTaiwanThailandTrinidad and TobagoTurkeyUgandaUkraineUruguayUzbekistanVenezuelaVietnamWest IndiesWestern AfricaWestern AsiaWestern EuropeYemenZaireZimbabweAzores
Select to Compare
Race
Ancestry
AfghanAfricanAlaska NativeAlaskan AthabascanAlbanianAleutAlsatianAmericanApacheArabArapahoArgentineanArmenianAssyrian/Chaldean/SyriacAustralianAustrianBahamianBangladeshiBarbadianBasqueBelgianBelizeanBermudanBhutaneseBlackfeetBolivianBrazilianBritishBritish West IndianBulgarianBurmeseCajunCambodianCanadianCape VerdeanCarpatho RusynCelticCentral AmericanCentral American IndianCherokeeCheyenneChickasawChileanChineseChippewaChoctawColombianColvilleComancheCosta RicanCreeCreekCroatianCrowCubanCypriotCzechCzechoslovakianDanishDelawareDominicanDutchDutch West IndianEastern EuropeanEcuadorianEgyptianEnglishEstonianEthiopianEuropeanFijianFilipinoFinnishFrenchFrench American IndianFrench CanadianGermanGerman RussianGhanaianGreekGuamanian/ChamorroGuatemalanGuyaneseHaitianHmongHonduranHopiHoumaHungarianIcelanderIndian (Asian)IndonesianInupiatIranianIraqiIrishIroquoisIsraeliItalianJamaicanJapaneseJordanianKenyanKiowaKoreanLaotianLatvianLebaneseLiberianLithuanianLumbeeLuxembourgerMacedonianMalaysianMalteseMarshalleseMenomineeMexicanMexican American IndianMongolianMoroccanNative HawaiianNavajoNepaleseNew ZealanderNicaraguanNigerianNorthern EuropeanNorwegianOkinawanOsageOttawaPaiutePakistaniPalestinianPanamanianParaguayanPennsylvania GermanPeruvianPimaPolishPortuguesePotawatomiPuebloPuerto RicanPuget Sound SalishRomanianRussianSalvadoranSamoanScandinavianScotch-IrishScottishSeminoleSenegaleseSerbianShoshoneSierra LeoneanSiouxSlavicSlovakSloveneSomaliSouth AfricanSouth AmericanSouth American IndianSoviet UnionSpaniardSpanishSpanish AmericanSpanish American IndianSri LankanSubsaharan AfricanSudaneseSwedishSwissSyrianTaiwaneseThaiTlingit-HaidaTohono O'OdhamTonganTrinidadian and TobagonianTsimshianTurkishU.S. Virgin IslanderUgandanUkrainianUruguayanUteVenezuelanVietnameseWelshWest IndianYakamaYaquiYugoslavianYumanYup'ikZimbabwean
Immigration
NonimmigrantsImmigrantsAfghanistanAfricaAlbaniaArgentinaArmeniaAsiaAustraliaAustriaBahamasBangladeshBarbadosBelarusBelgiumBelizeBoliviaBosnia and HerzegovinaBrazilBulgariaBurma/MyanmarCabo VerdeCambodiaCameroonCanadaCaribbeanCentral AmericaChileChinaColombiaCongoCosta RicaCroatiaCubaCzechoslovakiaDenmarkDominicaDominican RepublicEastern AfricaEastern AsiaEastern EuropeEcuadorEgyptEl SalvadorEnglandEritreaEthiopiaEuropeFijiFranceGermanyGhanaGreeceGrenadaGuatemalaGuyanaHaitiHondurasHong KongHungaryIndiaIndonesiaIranIraqIrelandIsraelItalyJamaicaJapanJordanKazakhstanKenyaKoreaKuwaitLaosLatin AmericaLatviaLebanonLiberiaLithuaniaMalaysiaMexicoMicronesiaMiddle AfricaMoldovaMoroccoNepalNetherlandsNicaraguaNigeriaNorth AmericaNorth MacedoniaNorthern AfricaNorthern EuropeNorwayOceaniaPakistanPanamaPeruPhilippinesPolandPortugalRomaniaRussiaSaudi ArabiaScotlandSenegalSerbiaSierra LeoneSingaporeSomaliaSouth AfricaSouth AmericaSouth Central AsiaSouth Eastern AsiaSouthern EuropeSpainSri LankaSt. Vincent and the GrenadinesSudanSwedenSwitzerlandSyriaTaiwanThailandTrinidad and TobagoTurkeyUgandaUkraineUruguayUzbekistanVenezuelaVietnamWest IndiesWestern AfricaWestern AsiaYemenZaireZimbabweAzores
1 or more Vehicles in Household
Income
Poverty
Unemployment
Labor Participation
Family Structure
Vehicle Availability
Education Level
Disability

Immigrants from Western Europe 1 or more Vehicles in Household
Fair

89.2%
1+ VEHICLES AVAILABLE
20.5/ 100
METRIC RATING
201st/ 347
METRIC RANK

Immigrants from Western Europe 1 or more Vehicles in Household Correlation Chart

The statistical analysis conducted on geographies consisting of 493,868,131 people shows a weak positive correlation between the proportion of Immigrants from Western Europe and percentage of households with 1 or more vehicles available in the United States with a correlation coefficient (R) of 0.276 and weighted average of 89.2%. On average, for every 1% (one percent) increase in Immigrants from Western Europe within a typical geography, there is an increase of 0.11% in percentage of households with 1 or more vehicles available.
Immigrants from Western Europe 1 or more Vehicles in Household
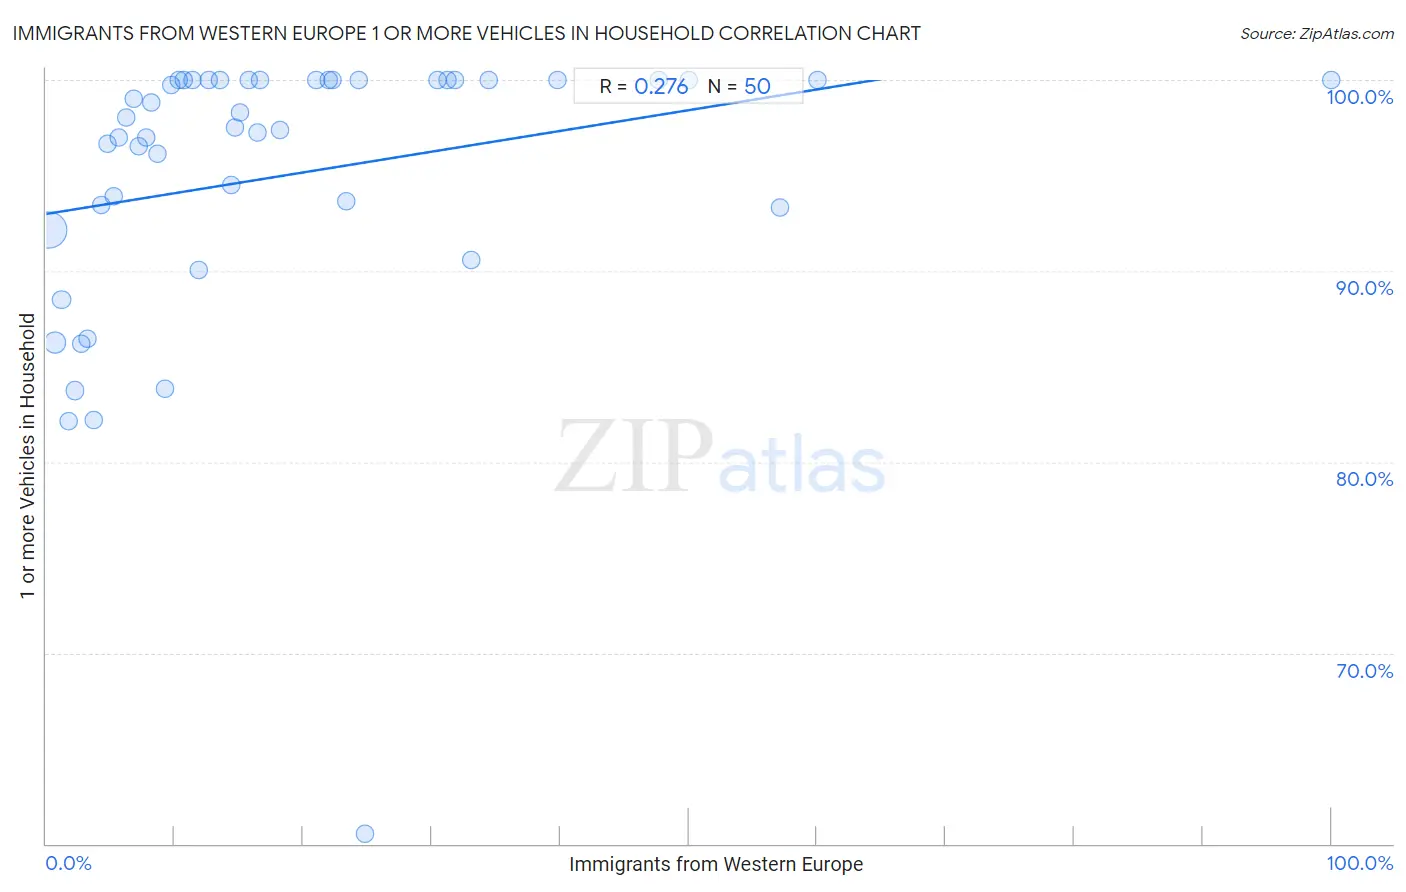
It is essential to understand that the correlation between the percentage of Immigrants from Western Europe and percentage of households with 1 or more vehicles available does not imply a direct cause-and-effect relationship. It remains uncertain whether the presence of Immigrants from Western Europe influences an upward or downward trend in the level of percentage of households with 1 or more vehicles available within an area, or if Immigrants from Western Europe simply ended up residing in those areas with higher or lower levels of percentage of households with 1 or more vehicles available due to other factors.

Demographics Similar to Immigrants from Western Europe by 1 or more Vehicles in Household

In terms of 1 or more vehicles in household, the demographic groups most similar to Immigrants from Western Europe are Central American (89.2%, a difference of 0.020%), Iroquois (89.2%, a difference of 0.020%), Cambodian (89.2%, a difference of 0.040%), Immigrants from Asia (89.3%, a difference of 0.050%), and Pennsylvania German (89.3%, a difference of 0.060%).
DemographicsRating | Rank1 or more Vehicles in Household
Immigrants from Eritrea
33.2
/100
|
#194
Fair
89.4%
Immigrants from Armenia
31.8
/100
|
#195
Fair
89.4%
Crow
24.3
/100
|
#196
Fair
89.3%
Immigrants from Sweden
23.6
/100
|
#197
Fair
89.3%
Pennsylvania Germans
22.9
/100
|
#198
Fair
89.3%
Immigrants from Asia
22.8
/100
|
#199
Fair
89.3%
Central Americans
21.4
/100
|
#200
Fair
89.2%
Immigrants from Western Europe
20.5
/100
|
#201
Fair
89.2%
Iroquois
19.8
/100
|
#202
Poor
89.2%
Cambodians
18.9
/100
|
#203
Poor
89.2%
Romanians
18.2
/100
|
#204
Poor
89.2%
Guatemalans
17.8
/100
|
#205
Poor
89.2%
Apache
16.2
/100
|
#206
Poor
89.1%
Immigrants from Denmark
14.8
/100
|
#207
Poor
89.1%
Immigrants from Chile
14.4
/100
|
#208
Poor
89.1%

Immigrants from Western Europe 1 or more Vehicles in Household Correlation Summary

MeasurementImmigrants from Western Europe Data1 or more Vehicles in Household Data
Minimum0.21%60.5%
Maximum100.0%100.0%
Range99.8%39.5%
Mean18.7%95.0%
Median13.1%97.8%
Interquartile 25% (IQ1)6.3%93.3%
Interquartile 75% (IQ3)24.3%100.0%
Interquartile Range (IQR)18.0%6.7%
Standard Deviation (Sample)18.8%7.4%
Standard Deviation (Population)18.7%7.4%

Correlation Details

Immigrants from Western Europe PercentileSample Size1 or more Vehicles in Household
[
0.0%
-
0.5%
]
0.21%
395,851,84692.1%
[
0.5%
-
1.0%
]
0.66%
77,234,63086.2%
[
1.0%
-
1.5%
]
1.19%
13,242,77888.5%
[
1.5%
-
2.0%
]
1.71%
4,217,02082.1%
[
2.0%
-
2.5%
]
2.20%
2,094,90283.7%
[
2.5%
-
3.0%
]
2.73%
642,44286.2%
[
3.0%
-
3.5%
]
3.25%
210,50986.4%
[
3.5%
-
4.0%
]
3.65%
141,43682.2%
[
4.0%
-
4.5%
]
4.25%
63,46193.5%
[
4.5%
-
5.0%
]
4.77%
42,15596.7%
[
5.0%
-
5.5%
]
5.30%
45,95993.9%
[
5.5%
-
6.0%
]
5.67%
11,59497.0%
[
6.0%
-
6.5%
]
6.25%
10,61698.1%
[
6.5%
-
7.0%
]
6.82%
4,64999.0%
[
7.0%
-
7.5%
]
7.20%
11,28996.5%
[
7.5%
-
8.0%
]
7.74%
9,55997.0%
[
8.0%
-
8.5%
]
8.17%
3,75898.8%
[
8.5%
-
9.0%
]
8.62%
9,10996.2%
[
9.0%
-
9.5%
]
9.23%
5,17983.8%
[
9.5%
-
10.0%
]
9.71%
3,97699.7%
[
10.0%
-
10.5%
]
10.29%
2,400100.0%
[
10.5%
-
11.0%
]
10.67%
900100.0%
[
11.0%
-
11.5%
]
11.34%
591100.0%
[
11.5%
-
12.0%
]
11.84%
15290.1%
[
12.5%
-
13.0%
]
12.61%
690100.0%
[
13.5%
-
14.0%
]
13.56%
118100.0%
[
14.0%
-
14.5%
]
14.35%
41894.5%
[
14.5%
-
15.0%
]
14.69%
17797.5%
[
15.0%
-
15.5%
]
15.04%
83898.3%
[
15.5%
-
16.0%
]
15.75%
273100.0%
[
16.0%
-
16.5%
]
16.47%
83297.3%
[
16.5%
-
17.0%
]
16.67%
144100.0%
[
18.0%
-
18.5%
]
18.16%
1,75197.4%
[
21.0%
-
21.5%
]
21.05%
95100.0%
[
21.5%
-
22.0%
]
21.98%
91100.0%
[
22.0%
-
22.5%
]
22.26%
274100.0%
[
23.0%
-
23.5%
]
23.35%
62193.6%
[
24.0%
-
24.5%
]
24.27%
103100.0%
[
24.5%
-
25.0%
]
24.78%
11360.5%
[
30.0%
-
30.5%
]
30.43%
46100.0%
[
31.0%
-
31.5%
]
31.25%
16100.0%
[
31.5%
-
32.0%
]
31.82%
44100.0%
[
33.0%
-
33.5%
]
33.10%
14290.6%
[
34.0%
-
34.5%
]
34.48%
58100.0%
[
39.5%
-
40.0%
]
39.78%
93100.0%
[
47.5%
-
48.0%
]
47.69%
65100.0%
[
50.0%
-
50.5%
]
50.00%
12100.0%
[
57.0%
-
57.5%
]
57.14%
13393.3%
[
60.0%
-
60.5%
]
60.00%
25100.0%
[
99.5%
-
100.0%
]
100.00%
49100.0%