Immigrants from Western Europe 2 or more Vehicles in Household

COMPARE

Immigrants from Western Europe
Race
Ancestry
AfghanAfricanAlaska NativeAlaskan AthabascanAlbanianAleutAlsatianAmericanApacheArabArapahoArgentineanArmenianAssyrian/Chaldean/SyriacAustralianAustrianBahamianBangladeshiBarbadianBasqueBelgianBelizeanBermudanBhutaneseBlackfeetBolivianBrazilianBritishBritish West IndianBulgarianBurmeseCajunCambodianCanadianCape VerdeanCarpatho RusynCelticCentral AmericanCentral American IndianCherokeeCheyenneChickasawChileanChineseChippewaChoctawColombianColvilleComancheCosta RicanCreeCreekCroatianCrowCubanCypriotCzechCzechoslovakianDanishDelawareDominicanDutchDutch West IndianEastern EuropeanEcuadorianEgyptianEnglishEstonianEthiopianEuropeanFijianFilipinoFinnishFrenchFrench American IndianFrench CanadianGermanGerman RussianGhanaianGreekGuamanian/ChamorroGuatemalanGuyaneseHaitianHmongHonduranHopiHoumaHungarianIcelanderIndian (Asian)IndonesianInupiatIranianIraqiIrishIroquoisIsraeliItalianJamaicanJapaneseJordanianKenyanKiowaKoreanLaotianLatvianLebaneseLiberianLithuanianLumbeeLuxembourgerMacedonianMalaysianMalteseMarshalleseMenomineeMexicanMexican American IndianMongolianMoroccanNative HawaiianNavajoNepaleseNew ZealanderNicaraguanNigerianNorthern EuropeanNorwegianOkinawanOsageOttawaPaiutePakistaniPalestinianPanamanianParaguayanPennsylvania GermanPeruvianPimaPolishPortuguesePotawatomiPuebloPuerto RicanPuget Sound SalishRomanianRussianSalvadoranSamoanScandinavianScotch-IrishScottishSeminoleSenegaleseSerbianShoshoneSierra LeoneanSiouxSlavicSlovakSloveneSomaliSouth AfricanSouth AmericanSouth American IndianSoviet UnionSpaniardSpanishSpanish AmericanSpanish American IndianSri LankanSubsaharan AfricanSudaneseSwedishSwissSyrianTaiwaneseThaiTlingit-HaidaTohono O'OdhamTonganTrinidadian and TobagonianTsimshianTurkishU.S. Virgin IslanderUgandanUkrainianUruguayanUteVenezuelanVietnameseWelshWest IndianYakamaYaquiYugoslavianYumanYup'ikZimbabwean
Immigration
NonimmigrantsImmigrantsAfghanistanAfricaAlbaniaArgentinaArmeniaAsiaAustraliaAustriaBahamasBangladeshBarbadosBelarusBelgiumBelizeBoliviaBosnia and HerzegovinaBrazilBulgariaBurma/MyanmarCabo VerdeCambodiaCameroonCanadaCaribbeanCentral AmericaChileChinaColombiaCongoCosta RicaCroatiaCubaCzechoslovakiaDenmarkDominicaDominican RepublicEastern AfricaEastern AsiaEastern EuropeEcuadorEgyptEl SalvadorEnglandEritreaEthiopiaEuropeFijiFranceGermanyGhanaGreeceGrenadaGuatemalaGuyanaHaitiHondurasHong KongHungaryIndiaIndonesiaIranIraqIrelandIsraelItalyJamaicaJapanJordanKazakhstanKenyaKoreaKuwaitLaosLatin AmericaLatviaLebanonLiberiaLithuaniaMalaysiaMexicoMicronesiaMiddle AfricaMoldovaMoroccoNepalNetherlandsNicaraguaNigeriaNorth AmericaNorth MacedoniaNorthern AfricaNorthern EuropeNorwayOceaniaPakistanPanamaPeruPhilippinesPolandPortugalRomaniaRussiaSaudi ArabiaScotlandSenegalSerbiaSierra LeoneSingaporeSomaliaSouth AfricaSouth AmericaSouth Central AsiaSouth Eastern AsiaSouthern EuropeSpainSri LankaSt. Vincent and the GrenadinesSudanSwedenSwitzerlandSyriaTaiwanThailandTrinidad and TobagoTurkeyUgandaUkraineUruguayUzbekistanVenezuelaVietnamWest IndiesWestern AfricaWestern AsiaWestern EuropeYemenZaireZimbabweAzores
Select to Compare
Race
Ancestry
AfghanAfricanAlaska NativeAlaskan AthabascanAlbanianAleutAlsatianAmericanApacheArabArapahoArgentineanArmenianAssyrian/Chaldean/SyriacAustralianAustrianBahamianBangladeshiBarbadianBasqueBelgianBelizeanBermudanBhutaneseBlackfeetBolivianBrazilianBritishBritish West IndianBulgarianBurmeseCajunCambodianCanadianCape VerdeanCarpatho RusynCelticCentral AmericanCentral American IndianCherokeeCheyenneChickasawChileanChineseChippewaChoctawColombianColvilleComancheCosta RicanCreeCreekCroatianCrowCubanCypriotCzechCzechoslovakianDanishDelawareDominicanDutchDutch West IndianEastern EuropeanEcuadorianEgyptianEnglishEstonianEthiopianEuropeanFijianFilipinoFinnishFrenchFrench American IndianFrench CanadianGermanGerman RussianGhanaianGreekGuamanian/ChamorroGuatemalanGuyaneseHaitianHmongHonduranHopiHoumaHungarianIcelanderIndian (Asian)IndonesianInupiatIranianIraqiIrishIroquoisIsraeliItalianJamaicanJapaneseJordanianKenyanKiowaKoreanLaotianLatvianLebaneseLiberianLithuanianLumbeeLuxembourgerMacedonianMalaysianMalteseMarshalleseMenomineeMexicanMexican American IndianMongolianMoroccanNative HawaiianNavajoNepaleseNew ZealanderNicaraguanNigerianNorthern EuropeanNorwegianOkinawanOsageOttawaPaiutePakistaniPalestinianPanamanianParaguayanPennsylvania GermanPeruvianPimaPolishPortuguesePotawatomiPuebloPuerto RicanPuget Sound SalishRomanianRussianSalvadoranSamoanScandinavianScotch-IrishScottishSeminoleSenegaleseSerbianShoshoneSierra LeoneanSiouxSlavicSlovakSloveneSomaliSouth AfricanSouth AmericanSouth American IndianSoviet UnionSpaniardSpanishSpanish AmericanSpanish American IndianSri LankanSubsaharan AfricanSudaneseSwedishSwissSyrianTaiwaneseThaiTlingit-HaidaTohono O'OdhamTonganTrinidadian and TobagonianTsimshianTurkishU.S. Virgin IslanderUgandanUkrainianUruguayanUteVenezuelanVietnameseWelshWest IndianYakamaYaquiYugoslavianYumanYup'ikZimbabwean
Immigration
NonimmigrantsImmigrantsAfghanistanAfricaAlbaniaArgentinaArmeniaAsiaAustraliaAustriaBahamasBangladeshBarbadosBelarusBelgiumBelizeBoliviaBosnia and HerzegovinaBrazilBulgariaBurma/MyanmarCabo VerdeCambodiaCameroonCanadaCaribbeanCentral AmericaChileChinaColombiaCongoCosta RicaCroatiaCubaCzechoslovakiaDenmarkDominicaDominican RepublicEastern AfricaEastern AsiaEastern EuropeEcuadorEgyptEl SalvadorEnglandEritreaEthiopiaEuropeFijiFranceGermanyGhanaGreeceGrenadaGuatemalaGuyanaHaitiHondurasHong KongHungaryIndiaIndonesiaIranIraqIrelandIsraelItalyJamaicaJapanJordanKazakhstanKenyaKoreaKuwaitLaosLatin AmericaLatviaLebanonLiberiaLithuaniaMalaysiaMexicoMicronesiaMiddle AfricaMoldovaMoroccoNepalNetherlandsNicaraguaNigeriaNorth AmericaNorth MacedoniaNorthern AfricaNorthern EuropeNorwayOceaniaPakistanPanamaPeruPhilippinesPolandPortugalRomaniaRussiaSaudi ArabiaScotlandSenegalSerbiaSierra LeoneSingaporeSomaliaSouth AfricaSouth AmericaSouth Central AsiaSouth Eastern AsiaSouthern EuropeSpainSri LankaSt. Vincent and the GrenadinesSudanSwedenSwitzerlandSyriaTaiwanThailandTrinidad and TobagoTurkeyUgandaUkraineUruguayUzbekistanVenezuelaVietnamWest IndiesWestern AfricaWestern AsiaYemenZaireZimbabweAzores
2 or more Vehicles in Household
Income
Poverty
Unemployment
Labor Participation
Family Structure
Vehicle Availability
Education Level
Disability

Immigrants from Western Europe 2 or more Vehicles in Household
Average

55.4%
2+ VEHICLES AVAILABLE
51.4/ 100
METRIC RATING
173rd/ 347
METRIC RANK

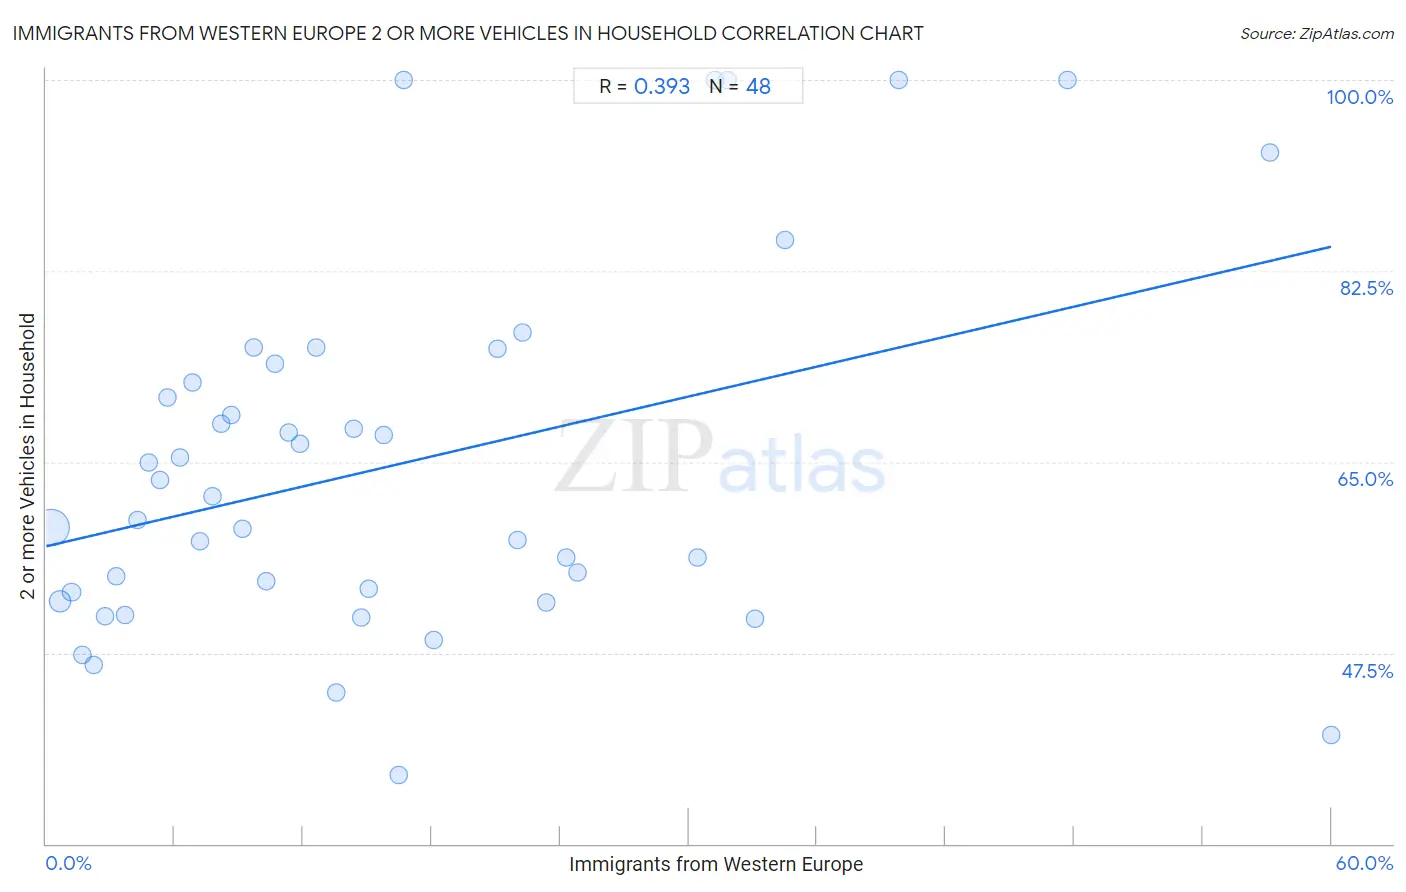
Immigrants from Western Europe 2 or more Vehicles in Household Correlation Chart

The statistical analysis conducted on geographies consisting of 493,846,859 people shows a mild positive correlation between the proportion of Immigrants from Western Europe and percentage of households with 2 or more vehicles available in the United States with a correlation coefficient (R) of 0.393 and weighted average of 55.4%. On average, for every 1% (one percent) increase in Immigrants from Western Europe within a typical geography, there is an increase of 0.46% in percentage of households with 2 or more vehicles available.
Immigrants from Western Europe 2 or more Vehicles in Household
It is essential to understand that the correlation between the percentage of Immigrants from Western Europe and percentage of households with 2 or more vehicles available does not imply a direct cause-and-effect relationship. It remains uncertain whether the presence of Immigrants from Western Europe influences an upward or downward trend in the level of percentage of households with 2 or more vehicles available within an area, or if Immigrants from Western Europe simply ended up residing in those areas with higher or lower levels of percentage of households with 2 or more vehicles available due to other factors.

Demographics Similar to Immigrants from Western Europe by 2 or more Vehicles in Household

In terms of 2 or more vehicles in household, the demographic groups most similar to Immigrants from Western Europe are Immigrants from Nicaragua (55.4%, a difference of 0.010%), Navajo (55.3%, a difference of 0.050%), Immigrants from Denmark (55.3%, a difference of 0.080%), Immigrants from Costa Rica (55.4%, a difference of 0.12%), and Immigrants from Cuba (55.3%, a difference of 0.17%).
DemographicsRating | Rank2 or more Vehicles in Household
Immigrants from Sri Lanka
58.3
/100
|
#166
Average
55.5%
Kenyans
58.1
/100
|
#167
Average
55.5%
French American Indians
56.7
/100
|
#168
Average
55.5%
Immigrants from Austria
56.3
/100
|
#169
Average
55.5%
Romanians
55.8
/100
|
#170
Average
55.5%
Immigrants from Costa Rica
54.4
/100
|
#171
Average
55.4%
Immigrants from Nicaragua
51.6
/100
|
#172
Average
55.4%
Immigrants from Western Europe
51.4
/100
|
#173
Average
55.4%
Navajo
50.0
/100
|
#174
Average
55.3%
Immigrants from Denmark
49.4
/100
|
#175
Average
55.3%
Immigrants from Cuba
47.0
/100
|
#176
Average
55.3%
Menominee
46.2
/100
|
#177
Average
55.3%
Immigrants from Sweden
45.3
/100
|
#178
Average
55.2%
Alaskan Athabascans
42.9
/100
|
#179
Average
55.2%
Immigrants from Kenya
40.4
/100
|
#180
Average
55.1%

Immigrants from Western Europe 2 or more Vehicles in Household Correlation Summary

MeasurementImmigrants from Western Europe Data2 or more Vehicles in Household Data
Minimum0.21%36.3%
Maximum60.0%100.0%
Range59.8%63.7%
Mean16.3%64.7%
Median12.2%60.8%
Interquartile 25% (IQ1)6.0%52.7%
Interquartile 75% (IQ3)22.8%73.1%
Interquartile Range (IQR)16.8%20.5%
Standard Deviation (Sample)14.3%16.6%
Standard Deviation (Population)14.1%16.4%

Correlation Details

Immigrants from Western Europe PercentileSample Size2 or more Vehicles in Household
[
0.0%
-
0.5%
]
0.21%
395,839,04159.0%
[
0.5%
-
1.0%
]
0.66%
77,231,93652.2%
[
1.0%
-
1.5%
]
1.19%
13,242,77853.1%
[
1.5%
-
2.0%
]
1.71%
4,217,02047.3%
[
2.0%
-
2.5%
]
2.20%
2,094,90246.4%
[
2.5%
-
3.0%
]
2.73%
642,44250.8%
[
3.0%
-
3.5%
]
3.25%
210,50954.5%
[
3.5%
-
4.0%
]
3.65%
139,65151.0%
[
4.0%
-
4.5%
]
4.25%
63,46159.7%
[
4.5%
-
5.0%
]
4.77%
42,15565.0%
[
5.0%
-
5.5%
]
5.30%
43,96563.3%
[
5.5%
-
6.0%
]
5.67%
11,59470.9%
[
6.0%
-
6.5%
]
6.25%
10,61665.4%
[
6.5%
-
7.0%
]
6.82%
4,64972.2%
[
7.0%
-
7.5%
]
7.20%
11,28957.7%
[
7.5%
-
8.0%
]
7.74%
9,55961.8%
[
8.0%
-
8.5%
]
8.17%
3,75868.5%
[
8.5%
-
9.0%
]
8.62%
9,10969.3%
[
9.0%
-
9.5%
]
9.16%
3,65658.9%
[
9.5%
-
10.0%
]
9.71%
3,97675.5%
[
10.0%
-
10.5%
]
10.29%
2,40054.1%
[
10.5%
-
11.0%
]
10.67%
90074.0%
[
11.0%
-
11.5%
]
11.34%
59167.7%
[
11.5%
-
12.0%
]
11.84%
15266.7%
[
12.5%
-
13.0%
]
12.61%
69075.5%
[
13.5%
-
14.0%
]
13.56%
11843.8%
[
14.0%
-
14.5%
]
14.35%
41868.0%
[
14.5%
-
15.0%
]
14.69%
17750.7%
[
15.0%
-
15.5%
]
15.04%
83853.3%
[
15.5%
-
16.0%
]
15.75%
27367.4%
[
16.0%
-
16.5%
]
16.47%
83236.3%
[
16.5%
-
17.0%
]
16.67%
144100.0%
[
18.0%
-
18.5%
]
18.12%
1,34148.7%
[
21.0%
-
21.5%
]
21.05%
9575.4%
[
21.5%
-
22.0%
]
21.98%
9157.9%
[
22.0%
-
22.5%
]
22.26%
27476.9%
[
23.0%
-
23.5%
]
23.35%
62152.1%
[
24.0%
-
24.5%
]
24.27%
10356.2%
[
24.5%
-
25.0%
]
24.78%
11354.8%
[
30.0%
-
30.5%
]
30.43%
4656.2%
[
31.0%
-
31.5%
]
31.25%
16100.0%
[
31.5%
-
32.0%
]
31.82%
44100.0%
[
33.0%
-
33.5%
]
33.10%
14250.6%
[
34.0%
-
34.5%
]
34.48%
5885.3%
[
39.5%
-
40.0%
]
39.78%
93100.0%
[
47.5%
-
48.0%
]
47.69%
65100.0%
[
57.0%
-
57.5%
]
57.14%
13393.3%
[
60.0%
-
60.5%
]
60.00%
2540.0%