Immigrants from Western Europe 4 or more Vehicles in Household

COMPARE

Immigrants from Western Europe
Race
Ancestry
AfghanAfricanAlaska NativeAlaskan AthabascanAlbanianAleutAlsatianAmericanApacheArabArapahoArgentineanArmenianAssyrian/Chaldean/SyriacAustralianAustrianBahamianBangladeshiBarbadianBasqueBelgianBelizeanBermudanBhutaneseBlackfeetBolivianBrazilianBritishBritish West IndianBulgarianBurmeseCajunCambodianCanadianCape VerdeanCarpatho RusynCelticCentral AmericanCentral American IndianCherokeeCheyenneChickasawChileanChineseChippewaChoctawColombianColvilleComancheCosta RicanCreeCreekCroatianCrowCubanCypriotCzechCzechoslovakianDanishDelawareDominicanDutchDutch West IndianEastern EuropeanEcuadorianEgyptianEnglishEstonianEthiopianEuropeanFijianFilipinoFinnishFrenchFrench American IndianFrench CanadianGermanGerman RussianGhanaianGreekGuamanian/ChamorroGuatemalanGuyaneseHaitianHmongHonduranHopiHoumaHungarianIcelanderIndian (Asian)IndonesianInupiatIranianIraqiIrishIroquoisIsraeliItalianJamaicanJapaneseJordanianKenyanKiowaKoreanLaotianLatvianLebaneseLiberianLithuanianLumbeeLuxembourgerMacedonianMalaysianMalteseMarshalleseMenomineeMexicanMexican American IndianMongolianMoroccanNative HawaiianNavajoNepaleseNew ZealanderNicaraguanNigerianNorthern EuropeanNorwegianOkinawanOsageOttawaPaiutePakistaniPalestinianPanamanianParaguayanPennsylvania GermanPeruvianPimaPolishPortuguesePotawatomiPuebloPuerto RicanPuget Sound SalishRomanianRussianSalvadoranSamoanScandinavianScotch-IrishScottishSeminoleSenegaleseSerbianShoshoneSierra LeoneanSiouxSlavicSlovakSloveneSomaliSouth AfricanSouth AmericanSouth American IndianSoviet UnionSpaniardSpanishSpanish AmericanSpanish American IndianSri LankanSubsaharan AfricanSudaneseSwedishSwissSyrianTaiwaneseThaiTlingit-HaidaTohono O'OdhamTonganTrinidadian and TobagonianTsimshianTurkishU.S. Virgin IslanderUgandanUkrainianUruguayanUteVenezuelanVietnameseWelshWest IndianYakamaYaquiYugoslavianYumanYup'ikZimbabwean
Immigration
NonimmigrantsImmigrantsAfghanistanAfricaAlbaniaArgentinaArmeniaAsiaAustraliaAustriaBahamasBangladeshBarbadosBelarusBelgiumBelizeBoliviaBosnia and HerzegovinaBrazilBulgariaBurma/MyanmarCabo VerdeCambodiaCameroonCanadaCaribbeanCentral AmericaChileChinaColombiaCongoCosta RicaCroatiaCubaCzechoslovakiaDenmarkDominicaDominican RepublicEastern AfricaEastern AsiaEastern EuropeEcuadorEgyptEl SalvadorEnglandEritreaEthiopiaEuropeFijiFranceGermanyGhanaGreeceGrenadaGuatemalaGuyanaHaitiHondurasHong KongHungaryIndiaIndonesiaIranIraqIrelandIsraelItalyJamaicaJapanJordanKazakhstanKenyaKoreaKuwaitLaosLatin AmericaLatviaLebanonLiberiaLithuaniaMalaysiaMexicoMicronesiaMiddle AfricaMoldovaMoroccoNepalNetherlandsNicaraguaNigeriaNorth AmericaNorth MacedoniaNorthern AfricaNorthern EuropeNorwayOceaniaPakistanPanamaPeruPhilippinesPolandPortugalRomaniaRussiaSaudi ArabiaScotlandSenegalSerbiaSierra LeoneSingaporeSomaliaSouth AfricaSouth AmericaSouth Central AsiaSouth Eastern AsiaSouthern EuropeSpainSri LankaSt. Vincent and the GrenadinesSudanSwedenSwitzerlandSyriaTaiwanThailandTrinidad and TobagoTurkeyUgandaUkraineUruguayUzbekistanVenezuelaVietnamWest IndiesWestern AfricaWestern AsiaWestern EuropeYemenZaireZimbabweAzores
Select to Compare
Race
Ancestry
AfghanAfricanAlaska NativeAlaskan AthabascanAlbanianAleutAlsatianAmericanApacheArabArapahoArgentineanArmenianAssyrian/Chaldean/SyriacAustralianAustrianBahamianBangladeshiBarbadianBasqueBelgianBelizeanBermudanBhutaneseBlackfeetBolivianBrazilianBritishBritish West IndianBulgarianBurmeseCajunCambodianCanadianCape VerdeanCarpatho RusynCelticCentral AmericanCentral American IndianCherokeeCheyenneChickasawChileanChineseChippewaChoctawColombianColvilleComancheCosta RicanCreeCreekCroatianCrowCubanCypriotCzechCzechoslovakianDanishDelawareDominicanDutchDutch West IndianEastern EuropeanEcuadorianEgyptianEnglishEstonianEthiopianEuropeanFijianFilipinoFinnishFrenchFrench American IndianFrench CanadianGermanGerman RussianGhanaianGreekGuamanian/ChamorroGuatemalanGuyaneseHaitianHmongHonduranHopiHoumaHungarianIcelanderIndian (Asian)IndonesianInupiatIranianIraqiIrishIroquoisIsraeliItalianJamaicanJapaneseJordanianKenyanKiowaKoreanLaotianLatvianLebaneseLiberianLithuanianLumbeeLuxembourgerMacedonianMalaysianMalteseMarshalleseMenomineeMexicanMexican American IndianMongolianMoroccanNative HawaiianNavajoNepaleseNew ZealanderNicaraguanNigerianNorthern EuropeanNorwegianOkinawanOsageOttawaPaiutePakistaniPalestinianPanamanianParaguayanPennsylvania GermanPeruvianPimaPolishPortuguesePotawatomiPuebloPuerto RicanPuget Sound SalishRomanianRussianSalvadoranSamoanScandinavianScotch-IrishScottishSeminoleSenegaleseSerbianShoshoneSierra LeoneanSiouxSlavicSlovakSloveneSomaliSouth AfricanSouth AmericanSouth American IndianSoviet UnionSpaniardSpanishSpanish AmericanSpanish American IndianSri LankanSubsaharan AfricanSudaneseSwedishSwissSyrianTaiwaneseThaiTlingit-HaidaTohono O'OdhamTonganTrinidadian and TobagonianTsimshianTurkishU.S. Virgin IslanderUgandanUkrainianUruguayanUteVenezuelanVietnameseWelshWest IndianYakamaYaquiYugoslavianYumanYup'ikZimbabwean
Immigration
NonimmigrantsImmigrantsAfghanistanAfricaAlbaniaArgentinaArmeniaAsiaAustraliaAustriaBahamasBangladeshBarbadosBelarusBelgiumBelizeBoliviaBosnia and HerzegovinaBrazilBulgariaBurma/MyanmarCabo VerdeCambodiaCameroonCanadaCaribbeanCentral AmericaChileChinaColombiaCongoCosta RicaCroatiaCubaCzechoslovakiaDenmarkDominicaDominican RepublicEastern AfricaEastern AsiaEastern EuropeEcuadorEgyptEl SalvadorEnglandEritreaEthiopiaEuropeFijiFranceGermanyGhanaGreeceGrenadaGuatemalaGuyanaHaitiHondurasHong KongHungaryIndiaIndonesiaIranIraqIrelandIsraelItalyJamaicaJapanJordanKazakhstanKenyaKoreaKuwaitLaosLatin AmericaLatviaLebanonLiberiaLithuaniaMalaysiaMexicoMicronesiaMiddle AfricaMoldovaMoroccoNepalNetherlandsNicaraguaNigeriaNorth AmericaNorth MacedoniaNorthern AfricaNorthern EuropeNorwayOceaniaPakistanPanamaPeruPhilippinesPolandPortugalRomaniaRussiaSaudi ArabiaScotlandSenegalSerbiaSierra LeoneSingaporeSomaliaSouth AfricaSouth AmericaSouth Central AsiaSouth Eastern AsiaSouthern EuropeSpainSri LankaSt. Vincent and the GrenadinesSudanSwedenSwitzerlandSyriaTaiwanThailandTrinidad and TobagoTurkeyUgandaUkraineUruguayUzbekistanVenezuelaVietnamWest IndiesWestern AfricaWestern AsiaYemenZaireZimbabweAzores
4 or more Vehicles in Household
Income
Poverty
Unemployment
Labor Participation
Family Structure
Vehicle Availability
Education Level
Disability

Immigrants from Western Europe 4 or more Vehicles in Household
Average

6.3%
4+ VEHICLES AVAILABLE
48.8/ 100
METRIC RATING
175th/ 347
METRIC RANK

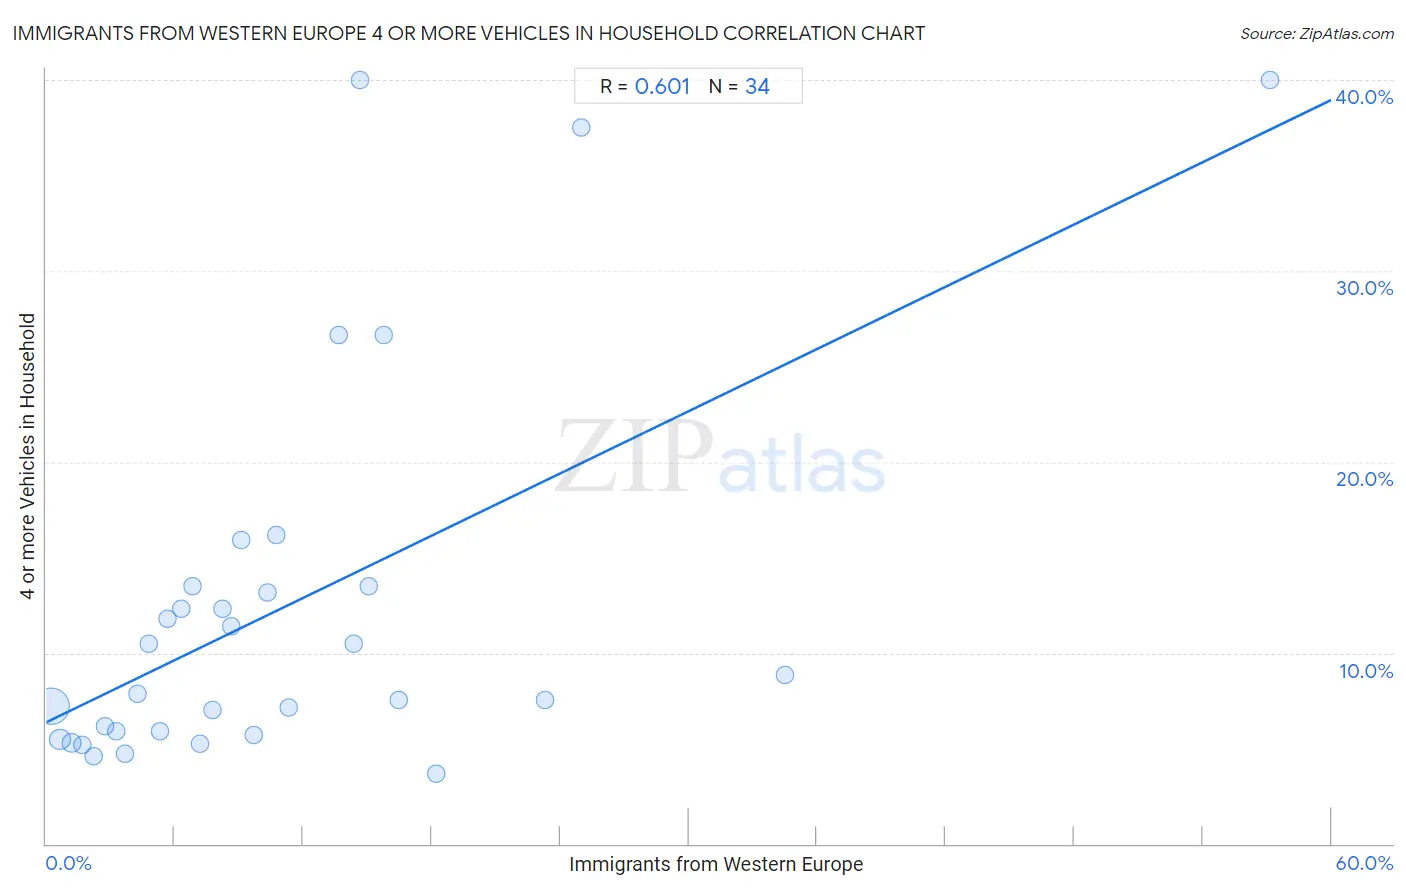
Immigrants from Western Europe 4 or more Vehicles in Household Correlation Chart

The statistical analysis conducted on geographies consisting of 491,787,926 people shows a significant positive correlation between the proportion of Immigrants from Western Europe and percentage of households with 4 or more vehicles available in the United States with a correlation coefficient (R) of 0.601 and weighted average of 6.3%. On average, for every 1% (one percent) increase in Immigrants from Western Europe within a typical geography, there is an increase of 0.54% in percentage of households with 4 or more vehicles available.
Immigrants from Western Europe 4 or more Vehicles in Household
It is essential to understand that the correlation between the percentage of Immigrants from Western Europe and percentage of households with 4 or more vehicles available does not imply a direct cause-and-effect relationship. It remains uncertain whether the presence of Immigrants from Western Europe influences an upward or downward trend in the level of percentage of households with 4 or more vehicles available within an area, or if Immigrants from Western Europe simply ended up residing in those areas with higher or lower levels of percentage of households with 4 or more vehicles available due to other factors.

Demographics Similar to Immigrants from Western Europe by 4 or more Vehicles in Household

In terms of 4 or more vehicles in household, the demographic groups most similar to Immigrants from Western Europe are Lithuanian (6.3%, a difference of 0.12%), Ukrainian (6.3%, a difference of 0.12%), Slovak (6.3%, a difference of 0.20%), Slovene (6.3%, a difference of 0.24%), and Immigrants from Lebanon (6.3%, a difference of 0.29%).
DemographicsRating | Rank4 or more Vehicles in Household
Lebanese
55.8
/100
|
#168
Average
6.4%
Estonians
55.1
/100
|
#169
Average
6.4%
Immigrants from Syria
52.8
/100
|
#170
Average
6.3%
Immigrants from India
51.9
/100
|
#171
Average
6.3%
Immigrants from Lebanon
51.7
/100
|
#172
Average
6.3%
Slovenes
51.1
/100
|
#173
Average
6.3%
Lithuanians
50.0
/100
|
#174
Average
6.3%
Immigrants from Western Europe
48.8
/100
|
#175
Average
6.3%
Ukrainians
47.6
/100
|
#176
Average
6.3%
Slovaks
46.9
/100
|
#177
Average
6.3%
Belizeans
44.5
/100
|
#178
Average
6.3%
Immigrants from Japan
43.1
/100
|
#179
Average
6.3%
Syrians
42.0
/100
|
#180
Average
6.3%
Yugoslavians
41.1
/100
|
#181
Average
6.3%
South American Indians
40.7
/100
|
#182
Average
6.3%

Immigrants from Western Europe 4 or more Vehicles in Household Correlation Summary

MeasurementImmigrants from Western Europe Data4 or more Vehicles in Household Data
Minimum0.21%3.7%
Maximum57.1%40.0%
Range56.9%36.3%
Mean11.2%12.4%
Median8.4%8.3%
Interquartile 25% (IQ1)4.3%5.9%
Interquartile 75% (IQ3)14.6%13.5%
Interquartile Range (IQR)10.4%7.6%
Standard Deviation (Sample)11.1%10.0%
Standard Deviation (Population)10.9%9.9%

Correlation Details

Immigrants from Western Europe PercentileSample Size4 or more Vehicles in Household
[
0.0%
-
0.5%
]
0.21%
395,006,7577.2%
[
0.5%
-
1.0%
]
0.66%
76,706,9135.5%
[
1.0%
-
1.5%
]
1.19%
13,001,4285.3%
[
1.5%
-
2.0%
]
1.71%
4,059,2205.2%
[
2.0%
-
2.5%
]
2.20%
1,903,2944.6%
[
2.5%
-
3.0%
]
2.73%
586,4286.2%
[
3.0%
-
3.5%
]
3.26%
201,1205.9%
[
3.5%
-
4.0%
]
3.65%
121,2434.7%
[
4.0%
-
4.5%
]
4.26%
61,8637.8%
[
4.5%
-
5.0%
]
4.79%
34,54210.5%
[
5.0%
-
5.5%
]
5.30%
41,8285.9%
[
5.5%
-
6.0%
]
5.66%
10,22611.8%
[
6.0%
-
6.5%
]
6.29%
7,61312.3%
[
6.5%
-
7.0%
]
6.84%
4,12513.5%
[
7.0%
-
7.5%
]
7.18%
9,8805.2%
[
7.5%
-
8.0%
]
7.74%
8,8807.0%
[
8.0%
-
8.5%
]
8.21%
2,22912.3%
[
8.5%
-
9.0%
]
8.61%
7,89611.4%
[
9.0%
-
9.5%
]
9.13%
1,74215.9%
[
9.5%
-
10.0%
]
9.71%
3,9765.7%
[
10.0%
-
10.5%
]
10.30%
2,03813.1%
[
10.5%
-
11.0%
]
10.76%
43716.2%
[
11.0%
-
11.5%
]
11.34%
5917.2%
[
13.5%
-
14.0%
]
13.64%
4426.7%
[
14.0%
-
14.5%
]
14.35%
41810.5%
[
14.5%
-
15.0%
]
14.63%
4140.0%
[
15.0%
-
15.5%
]
15.04%
83813.5%
[
15.5%
-
16.0%
]
15.75%
27326.7%
[
16.0%
-
16.5%
]
16.47%
6077.5%
[
18.0%
-
18.5%
]
18.19%
8303.7%
[
23.0%
-
23.5%
]
23.31%
3997.5%
[
25.0%
-
25.5%
]
25.00%
1637.5%
[
34.0%
-
34.5%
]
34.48%
588.8%
[
57.0%
-
57.5%
]
57.14%
13340.0%