Immigrants from Uganda Wage/Income Gap

COMPARE

Immigrants from Uganda
Race
Ancestry
AfghanAfricanAlaska NativeAlaskan AthabascanAlbanianAleutAlsatianAmericanApacheArabArapahoArgentineanArmenianAssyrian/Chaldean/SyriacAustralianAustrianBahamianBangladeshiBarbadianBasqueBelgianBelizeanBermudanBhutaneseBlackfeetBolivianBrazilianBritishBritish West IndianBulgarianBurmeseCajunCambodianCanadianCape VerdeanCarpatho RusynCelticCentral AmericanCentral American IndianCherokeeCheyenneChickasawChileanChineseChippewaChoctawColombianColvilleComancheCosta RicanCreeCreekCroatianCrowCubanCypriotCzechCzechoslovakianDanishDelawareDominicanDutchDutch West IndianEastern EuropeanEcuadorianEgyptianEnglishEstonianEthiopianEuropeanFijianFilipinoFinnishFrenchFrench American IndianFrench CanadianGermanGerman RussianGhanaianGreekGuamanian/ChamorroGuatemalanGuyaneseHaitianHmongHonduranHopiHoumaHungarianIcelanderIndian (Asian)IndonesianInupiatIranianIraqiIrishIroquoisIsraeliItalianJamaicanJapaneseJordanianKenyanKiowaKoreanLaotianLatvianLebaneseLiberianLithuanianLumbeeLuxembourgerMacedonianMalaysianMalteseMarshalleseMenomineeMexicanMexican American IndianMongolianMoroccanNative HawaiianNavajoNepaleseNew ZealanderNicaraguanNigerianNorthern EuropeanNorwegianOkinawanOsageOttawaPaiutePakistaniPalestinianPanamanianParaguayanPennsylvania GermanPeruvianPimaPolishPortuguesePotawatomiPuebloPuerto RicanPuget Sound SalishRomanianRussianSalvadoranSamoanScandinavianScotch-IrishScottishSeminoleSenegaleseSerbianShoshoneSierra LeoneanSiouxSlavicSlovakSloveneSomaliSouth AfricanSouth AmericanSouth American IndianSoviet UnionSpaniardSpanishSpanish AmericanSpanish American IndianSri LankanSubsaharan AfricanSudaneseSwedishSwissSyrianTaiwaneseThaiTlingit-HaidaTohono O'OdhamTonganTrinidadian and TobagonianTsimshianTurkishU.S. Virgin IslanderUgandanUkrainianUruguayanUteVenezuelanVietnameseWelshWest IndianYakamaYaquiYugoslavianYumanYup'ikZimbabwean
Immigration
NonimmigrantsImmigrantsAfghanistanAfricaAlbaniaArgentinaArmeniaAsiaAustraliaAustriaBahamasBangladeshBarbadosBelarusBelgiumBelizeBoliviaBosnia and HerzegovinaBrazilBulgariaBurma/MyanmarCabo VerdeCambodiaCameroonCanadaCaribbeanCentral AmericaChileChinaColombiaCongoCosta RicaCroatiaCubaCzechoslovakiaDenmarkDominicaDominican RepublicEastern AfricaEastern AsiaEastern EuropeEcuadorEgyptEl SalvadorEnglandEritreaEthiopiaEuropeFijiFranceGermanyGhanaGreeceGrenadaGuatemalaGuyanaHaitiHondurasHong KongHungaryIndiaIndonesiaIranIraqIrelandIsraelItalyJamaicaJapanJordanKazakhstanKenyaKoreaKuwaitLaosLatin AmericaLatviaLebanonLiberiaLithuaniaMalaysiaMexicoMicronesiaMiddle AfricaMoldovaMoroccoNepalNetherlandsNicaraguaNigeriaNorth AmericaNorth MacedoniaNorthern AfricaNorthern EuropeNorwayOceaniaPakistanPanamaPeruPhilippinesPolandPortugalRomaniaRussiaSaudi ArabiaScotlandSenegalSerbiaSierra LeoneSingaporeSomaliaSouth AfricaSouth AmericaSouth Central AsiaSouth Eastern AsiaSouthern EuropeSpainSri LankaSt. Vincent and the GrenadinesSudanSwedenSwitzerlandSyriaTaiwanThailandTrinidad and TobagoTurkeyUgandaUkraineUruguayUzbekistanVenezuelaVietnamWest IndiesWestern AfricaWestern AsiaWestern EuropeYemenZaireZimbabweAzores
Select to Compare
Race
Ancestry
AfghanAfricanAlaska NativeAlaskan AthabascanAlbanianAleutAlsatianAmericanApacheArabArapahoArgentineanArmenianAssyrian/Chaldean/SyriacAustralianAustrianBahamianBangladeshiBarbadianBasqueBelgianBelizeanBermudanBhutaneseBlackfeetBolivianBrazilianBritishBritish West IndianBulgarianBurmeseCajunCambodianCanadianCape VerdeanCarpatho RusynCelticCentral AmericanCentral American IndianCherokeeCheyenneChickasawChileanChineseChippewaChoctawColombianColvilleComancheCosta RicanCreeCreekCroatianCrowCubanCypriotCzechCzechoslovakianDanishDelawareDominicanDutchDutch West IndianEastern EuropeanEcuadorianEgyptianEnglishEstonianEthiopianEuropeanFijianFilipinoFinnishFrenchFrench American IndianFrench CanadianGermanGerman RussianGhanaianGreekGuamanian/ChamorroGuatemalanGuyaneseHaitianHmongHonduranHopiHoumaHungarianIcelanderIndian (Asian)IndonesianInupiatIranianIraqiIrishIroquoisIsraeliItalianJamaicanJapaneseJordanianKenyanKiowaKoreanLaotianLatvianLebaneseLiberianLithuanianLumbeeLuxembourgerMacedonianMalaysianMalteseMarshalleseMenomineeMexicanMexican American IndianMongolianMoroccanNative HawaiianNavajoNepaleseNew ZealanderNicaraguanNigerianNorthern EuropeanNorwegianOkinawanOsageOttawaPaiutePakistaniPalestinianPanamanianParaguayanPennsylvania GermanPeruvianPimaPolishPortuguesePotawatomiPuebloPuerto RicanPuget Sound SalishRomanianRussianSalvadoranSamoanScandinavianScotch-IrishScottishSeminoleSenegaleseSerbianShoshoneSierra LeoneanSiouxSlavicSlovakSloveneSomaliSouth AfricanSouth AmericanSouth American IndianSoviet UnionSpaniardSpanishSpanish AmericanSpanish American IndianSri LankanSubsaharan AfricanSudaneseSwedishSwissSyrianTaiwaneseThaiTlingit-HaidaTohono O'OdhamTonganTrinidadian and TobagonianTsimshianTurkishU.S. Virgin IslanderUgandanUkrainianUruguayanUteVenezuelanVietnameseWelshWest IndianYakamaYaquiYugoslavianYumanYup'ikZimbabwean
Immigration
NonimmigrantsImmigrantsAfghanistanAfricaAlbaniaArgentinaArmeniaAsiaAustraliaAustriaBahamasBangladeshBarbadosBelarusBelgiumBelizeBoliviaBosnia and HerzegovinaBrazilBulgariaBurma/MyanmarCabo VerdeCambodiaCameroonCanadaCaribbeanCentral AmericaChileChinaColombiaCongoCosta RicaCroatiaCubaCzechoslovakiaDenmarkDominicaDominican RepublicEastern AfricaEastern AsiaEastern EuropeEcuadorEgyptEl SalvadorEnglandEritreaEthiopiaEuropeFijiFranceGermanyGhanaGreeceGrenadaGuatemalaGuyanaHaitiHondurasHong KongHungaryIndiaIndonesiaIranIraqIrelandIsraelItalyJamaicaJapanJordanKazakhstanKenyaKoreaKuwaitLaosLatin AmericaLatviaLebanonLiberiaLithuaniaMalaysiaMexicoMicronesiaMiddle AfricaMoldovaMoroccoNepalNetherlandsNicaraguaNigeriaNorth AmericaNorth MacedoniaNorthern AfricaNorthern EuropeNorwayOceaniaPakistanPanamaPeruPhilippinesPolandPortugalRomaniaRussiaSaudi ArabiaScotlandSenegalSerbiaSierra LeoneSingaporeSomaliaSouth AfricaSouth AmericaSouth Central AsiaSouth Eastern AsiaSouthern EuropeSpainSri LankaSt. Vincent and the GrenadinesSudanSwedenSwitzerlandSyriaTaiwanThailandTrinidad and TobagoTurkeyUkraineUruguayUzbekistanVenezuelaVietnamWest IndiesWestern AfricaWestern AsiaWestern EuropeYemenZaireZimbabweAzores
Wage/Income Gap
Income
Poverty
Unemployment
Labor Participation
Family Structure
Vehicle Availability
Education Level
Disability

Immigrants from Uganda Wage/Income Gap
Excellent

24.9%
WAGE/INCOME GAP
88.0/ 100
METRIC RATING
143rd/ 347
METRIC RANK

Immigrants from Uganda Wage/Income Gap Correlation Chart

The statistical analysis conducted on geographies consisting of 125,961,415 people shows a mild positive correlation between the proportion of Immigrants from Uganda and wage/income gap percentage in the United States with a correlation coefficient (R) of 0.341 and weighted average of 24.9%. On average, for every 1% (one percent) increase in Immigrants from Uganda within a typical geography, there is an increase of 3.4% in wage/income gap percentage.
Immigrants from Uganda Wage/Income Gap
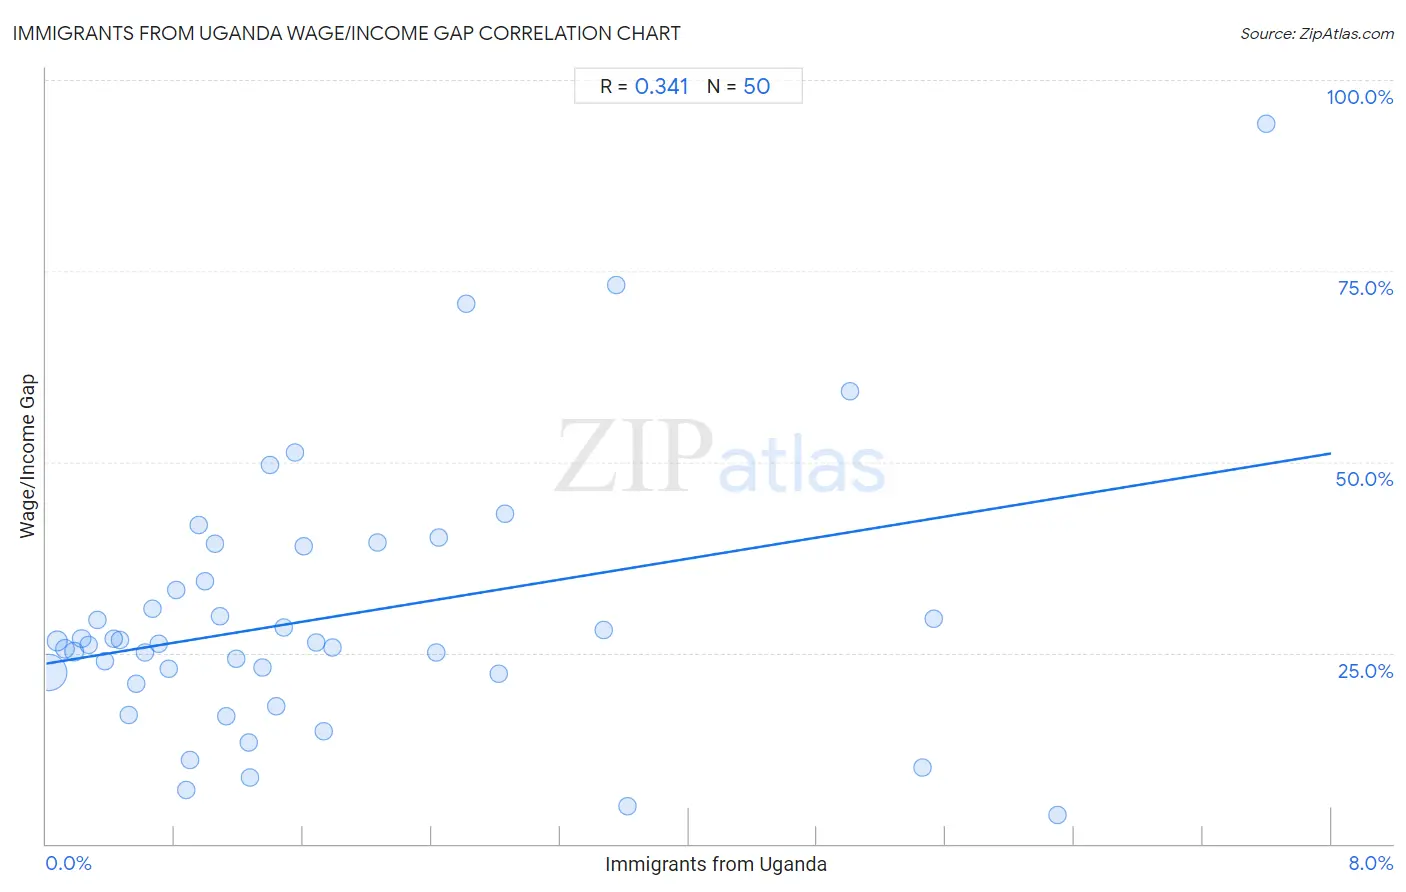
It is essential to understand that the correlation between the percentage of Immigrants from Uganda and wage/income gap percentage does not imply a direct cause-and-effect relationship. It remains uncertain whether the presence of Immigrants from Uganda influences an upward or downward trend in the level of wage/income gap percentage within an area, or if Immigrants from Uganda simply ended up residing in those areas with higher or lower levels of wage/income gap percentage due to other factors.

Demographics Similar to Immigrants from Uganda by Wage/Income Gap

In terms of wage/income gap, the demographic groups most similar to Immigrants from Uganda are Afghan (24.9%, a difference of 0.020%), Chippewa (25.0%, a difference of 0.18%), Immigrants from Nepal (24.9%, a difference of 0.22%), Hawaiian (24.9%, a difference of 0.22%), and Hispanic or Latino (24.9%, a difference of 0.25%).
DemographicsRating | RankWage/Income Gap
Armenians
91.3
/100
|
#136
Exceptional
24.8%
Immigrants from South Eastern Asia
90.9
/100
|
#137
Exceptional
24.8%
Immigrants from Bosnia and Herzegovina
90.1
/100
|
#138
Exceptional
24.8%
Hispanics or Latinos
89.5
/100
|
#139
Excellent
24.9%
Immigrants from Nepal
89.3
/100
|
#140
Excellent
24.9%
Hawaiians
89.3
/100
|
#141
Excellent
24.9%
Afghans
88.1
/100
|
#142
Excellent
24.9%
Immigrants from Uganda
88.0
/100
|
#143
Excellent
24.9%
Chippewa
86.9
/100
|
#144
Excellent
25.0%
Comanche
85.2
/100
|
#145
Excellent
25.0%
South Americans
85.2
/100
|
#146
Excellent
25.0%
Malaysians
84.9
/100
|
#147
Excellent
25.0%
Iroquois
83.9
/100
|
#148
Excellent
25.1%
Immigrants from Peru
82.6
/100
|
#149
Excellent
25.1%
Immigrants
82.3
/100
|
#150
Excellent
25.1%

Immigrants from Uganda Wage/Income Gap Correlation Summary

MeasurementImmigrants from Uganda DataWage/Income Gap Data
Minimum0.016%3.7%
Maximum7.6%94.2%
Range7.6%90.5%
Mean1.7%29.6%
Median1.2%26.3%
Interquartile 25% (IQ1)0.62%22.2%
Interquartile 75% (IQ3)2.4%34.4%
Interquartile Range (IQR)1.8%12.2%
Standard Deviation (Sample)1.7%17.3%
Standard Deviation (Population)1.7%17.1%

Correlation Details

Immigrants from Uganda PercentileSample SizeWage/Income Gap
[
0.0%
-
0.5%
]
0.016%
94,909,92722.5%
[
0.0%
-
0.5%
]
0.068%
15,616,64226.6%
[
0.0%
-
0.5%
]
0.12%
6,167,58725.5%
[
0.0%
-
0.5%
]
0.17%
2,274,78425.1%
[
0.0%
-
0.5%
]
0.22%
2,340,88826.8%
[
0.0%
-
0.5%
]
0.26%
1,189,61826.0%
[
0.0%
-
0.5%
]
0.32%
808,10729.4%
[
0.0%
-
0.5%
]
0.36%
490,71623.9%
[
0.0%
-
0.5%
]
0.42%
295,40126.9%
[
0.0%
-
0.5%
]
0.46%
482,79326.7%
[
0.5%
-
1.0%
]
0.51%
44,18616.9%
[
0.5%
-
1.0%
]
0.56%
225,46120.9%
[
0.5%
-
1.0%
]
0.62%
215,50625.0%
[
0.5%
-
1.0%
]
0.66%
219,87330.8%
[
0.5%
-
1.0%
]
0.70%
95,75026.2%
[
0.5%
-
1.0%
]
0.76%
43,99622.9%
[
0.5%
-
1.0%
]
0.81%
79,08733.2%
[
0.5%
-
1.0%
]
0.87%
12,7067.0%
[
0.5%
-
1.0%
]
0.89%
49,66310.9%
[
0.5%
-
1.0%
]
0.95%
16,11241.7%
[
0.5%
-
1.0%
]
0.99%
5,88734.4%
[
1.0%
-
1.5%
]
1.05%
4,09739.2%
[
1.0%
-
1.5%
]
1.08%
69,52429.7%
[
1.0%
-
1.5%
]
1.12%
32,76116.6%
[
1.0%
-
1.5%
]
1.18%
43,20824.2%
[
1.0%
-
1.5%
]
1.26%
13,51613.3%
[
1.0%
-
1.5%
]
1.27%
14,5538.7%
[
1.0%
-
1.5%
]
1.34%
68,89223.1%
[
1.0%
-
1.5%
]
1.39%
5,01849.5%
[
1.0%
-
1.5%
]
1.44%
1,53318.1%
[
1.0%
-
1.5%
]
1.48%
12,35528.4%
[
1.5%
-
2.0%
]
1.55%
23,08151.3%
[
1.5%
-
2.0%
]
1.60%
12,10838.9%
[
1.5%
-
2.0%
]
1.68%
23826.4%
[
1.5%
-
2.0%
]
1.73%
9,41514.7%
[
1.5%
-
2.0%
]
1.79%
2,96925.7%
[
2.0%
-
2.5%
]
2.07%
1,21039.4%
[
2.0%
-
2.5%
]
2.42%
66025.0%
[
2.0%
-
2.5%
]
2.45%
3,88440.1%
[
2.5%
-
3.0%
]
2.62%
5,46270.8%
[
2.5%
-
3.0%
]
2.81%
60422.2%
[
2.5%
-
3.0%
]
2.86%
31543.1%
[
3.0%
-
3.5%
]
3.47%
5,62228.0%
[
3.5%
-
4.0%
]
3.55%
33873.1%
[
3.5%
-
4.0%
]
3.62%
15,8304.8%
[
5.0%
-
5.5%
]
5.00%
18059.3%
[
5.0%
-
5.5%
]
5.46%
26,6849.9%
[
5.5%
-
6.0%
]
5.53%
1,04929.5%
[
6.0%
-
6.5%
]
6.29%
1,3033.7%
[
7.5%
-
8.0%
]
7.59%
31694.2%