Immigrants from Uganda Self-Care Disability

COMPARE

Immigrants from Uganda
Race
Ancestry
AfghanAfricanAlaska NativeAlaskan AthabascanAlbanianAleutAlsatianAmericanApacheArabArapahoArgentineanArmenianAssyrian/Chaldean/SyriacAustralianAustrianBahamianBangladeshiBarbadianBasqueBelgianBelizeanBermudanBhutaneseBlackfeetBolivianBrazilianBritishBritish West IndianBulgarianBurmeseCajunCambodianCanadianCape VerdeanCarpatho RusynCelticCentral AmericanCentral American IndianCherokeeCheyenneChickasawChileanChineseChippewaChoctawColombianColvilleComancheCosta RicanCreeCreekCroatianCrowCubanCypriotCzechCzechoslovakianDanishDelawareDominicanDutchDutch West IndianEastern EuropeanEcuadorianEgyptianEnglishEstonianEthiopianEuropeanFijianFilipinoFinnishFrenchFrench American IndianFrench CanadianGermanGerman RussianGhanaianGreekGuamanian/ChamorroGuatemalanGuyaneseHaitianHmongHonduranHopiHoumaHungarianIcelanderIndian (Asian)IndonesianInupiatIranianIraqiIrishIroquoisIsraeliItalianJamaicanJapaneseJordanianKenyanKiowaKoreanLaotianLatvianLebaneseLiberianLithuanianLumbeeLuxembourgerMacedonianMalaysianMalteseMarshalleseMenomineeMexicanMexican American IndianMongolianMoroccanNative HawaiianNavajoNepaleseNew ZealanderNicaraguanNigerianNorthern EuropeanNorwegianOkinawanOsageOttawaPaiutePakistaniPalestinianPanamanianParaguayanPennsylvania GermanPeruvianPimaPolishPortuguesePotawatomiPuebloPuerto RicanPuget Sound SalishRomanianRussianSalvadoranSamoanScandinavianScotch-IrishScottishSeminoleSenegaleseSerbianShoshoneSierra LeoneanSiouxSlavicSlovakSloveneSomaliSouth AfricanSouth AmericanSouth American IndianSoviet UnionSpaniardSpanishSpanish AmericanSpanish American IndianSri LankanSubsaharan AfricanSudaneseSwedishSwissSyrianTaiwaneseThaiTlingit-HaidaTohono O'OdhamTonganTrinidadian and TobagonianTsimshianTurkishU.S. Virgin IslanderUgandanUkrainianUruguayanUteVenezuelanVietnameseWelshWest IndianYakamaYaquiYugoslavianYumanYup'ikZimbabwean
Immigration
NonimmigrantsImmigrantsAfghanistanAfricaAlbaniaArgentinaArmeniaAsiaAustraliaAustriaBahamasBangladeshBarbadosBelarusBelgiumBelizeBoliviaBosnia and HerzegovinaBrazilBulgariaBurma/MyanmarCabo VerdeCambodiaCameroonCanadaCaribbeanCentral AmericaChileChinaColombiaCongoCosta RicaCroatiaCubaCzechoslovakiaDenmarkDominicaDominican RepublicEastern AfricaEastern AsiaEastern EuropeEcuadorEgyptEl SalvadorEnglandEritreaEthiopiaEuropeFijiFranceGermanyGhanaGreeceGrenadaGuatemalaGuyanaHaitiHondurasHong KongHungaryIndiaIndonesiaIranIraqIrelandIsraelItalyJamaicaJapanJordanKazakhstanKenyaKoreaKuwaitLaosLatin AmericaLatviaLebanonLiberiaLithuaniaMalaysiaMexicoMicronesiaMiddle AfricaMoldovaMoroccoNepalNetherlandsNicaraguaNigeriaNorth AmericaNorth MacedoniaNorthern AfricaNorthern EuropeNorwayOceaniaPakistanPanamaPeruPhilippinesPolandPortugalRomaniaRussiaSaudi ArabiaScotlandSenegalSerbiaSierra LeoneSingaporeSomaliaSouth AfricaSouth AmericaSouth Central AsiaSouth Eastern AsiaSouthern EuropeSpainSri LankaSt. Vincent and the GrenadinesSudanSwedenSwitzerlandSyriaTaiwanThailandTrinidad and TobagoTurkeyUgandaUkraineUruguayUzbekistanVenezuelaVietnamWest IndiesWestern AfricaWestern AsiaWestern EuropeYemenZaireZimbabweAzores
Select to Compare
Race
Ancestry
AfghanAfricanAlaska NativeAlaskan AthabascanAlbanianAleutAlsatianAmericanApacheArabArapahoArgentineanArmenianAssyrian/Chaldean/SyriacAustralianAustrianBahamianBangladeshiBarbadianBasqueBelgianBelizeanBermudanBhutaneseBlackfeetBolivianBrazilianBritishBritish West IndianBulgarianBurmeseCajunCambodianCanadianCape VerdeanCarpatho RusynCelticCentral AmericanCentral American IndianCherokeeCheyenneChickasawChileanChineseChippewaChoctawColombianColvilleComancheCosta RicanCreeCreekCroatianCrowCubanCypriotCzechCzechoslovakianDanishDelawareDominicanDutchDutch West IndianEastern EuropeanEcuadorianEgyptianEnglishEstonianEthiopianEuropeanFijianFilipinoFinnishFrenchFrench American IndianFrench CanadianGermanGerman RussianGhanaianGreekGuamanian/ChamorroGuatemalanGuyaneseHaitianHmongHonduranHopiHoumaHungarianIcelanderIndian (Asian)IndonesianInupiatIranianIraqiIrishIroquoisIsraeliItalianJamaicanJapaneseJordanianKenyanKiowaKoreanLaotianLatvianLebaneseLiberianLithuanianLumbeeLuxembourgerMacedonianMalaysianMalteseMarshalleseMenomineeMexicanMexican American IndianMongolianMoroccanNative HawaiianNavajoNepaleseNew ZealanderNicaraguanNigerianNorthern EuropeanNorwegianOkinawanOsageOttawaPaiutePakistaniPalestinianPanamanianParaguayanPennsylvania GermanPeruvianPimaPolishPortuguesePotawatomiPuebloPuerto RicanPuget Sound SalishRomanianRussianSalvadoranSamoanScandinavianScotch-IrishScottishSeminoleSenegaleseSerbianShoshoneSierra LeoneanSiouxSlavicSlovakSloveneSomaliSouth AfricanSouth AmericanSouth American IndianSoviet UnionSpaniardSpanishSpanish AmericanSpanish American IndianSri LankanSubsaharan AfricanSudaneseSwedishSwissSyrianTaiwaneseThaiTlingit-HaidaTohono O'OdhamTonganTrinidadian and TobagonianTsimshianTurkishU.S. Virgin IslanderUgandanUkrainianUruguayanUteVenezuelanVietnameseWelshWest IndianYakamaYaquiYugoslavianYumanYup'ikZimbabwean
Immigration
NonimmigrantsImmigrantsAfghanistanAfricaAlbaniaArgentinaArmeniaAsiaAustraliaAustriaBahamasBangladeshBarbadosBelarusBelgiumBelizeBoliviaBosnia and HerzegovinaBrazilBulgariaBurma/MyanmarCabo VerdeCambodiaCameroonCanadaCaribbeanCentral AmericaChileChinaColombiaCongoCosta RicaCroatiaCubaCzechoslovakiaDenmarkDominicaDominican RepublicEastern AfricaEastern AsiaEastern EuropeEcuadorEgyptEl SalvadorEnglandEritreaEthiopiaEuropeFijiFranceGermanyGhanaGreeceGrenadaGuatemalaGuyanaHaitiHondurasHong KongHungaryIndiaIndonesiaIranIraqIrelandIsraelItalyJamaicaJapanJordanKazakhstanKenyaKoreaKuwaitLaosLatin AmericaLatviaLebanonLiberiaLithuaniaMalaysiaMexicoMicronesiaMiddle AfricaMoldovaMoroccoNepalNetherlandsNicaraguaNigeriaNorth AmericaNorth MacedoniaNorthern AfricaNorthern EuropeNorwayOceaniaPakistanPanamaPeruPhilippinesPolandPortugalRomaniaRussiaSaudi ArabiaScotlandSenegalSerbiaSierra LeoneSingaporeSomaliaSouth AfricaSouth AmericaSouth Central AsiaSouth Eastern AsiaSouthern EuropeSpainSri LankaSt. Vincent and the GrenadinesSudanSwedenSwitzerlandSyriaTaiwanThailandTrinidad and TobagoTurkeyUkraineUruguayUzbekistanVenezuelaVietnamWest IndiesWestern AfricaWestern AsiaWestern EuropeYemenZaireZimbabweAzores
Self-Care Disability
Income
Poverty
Unemployment
Labor Participation
Family Structure
Vehicle Availability
Education Level
Disability

Immigrants from Uganda Self-Care Disability
Exceptional

2.3%
SELF-CARE DISABILITY
99.8/ 100
METRIC RATING
42nd/ 347
METRIC RANK

Immigrants from Uganda Self-Care Disability Correlation Chart

The statistical analysis conducted on geographies consisting of 125,933,706 people shows a weak negative correlation between the proportion of Immigrants from Uganda and percentage of population with self-care disability in the United States with a correlation coefficient (R) of -0.224 and weighted average of 2.3%. On average, for every 1% (one percent) increase in Immigrants from Uganda within a typical geography, there is a decrease of 0.094% in percentage of population with self-care disability.
Immigrants from Uganda Self-Care Disability
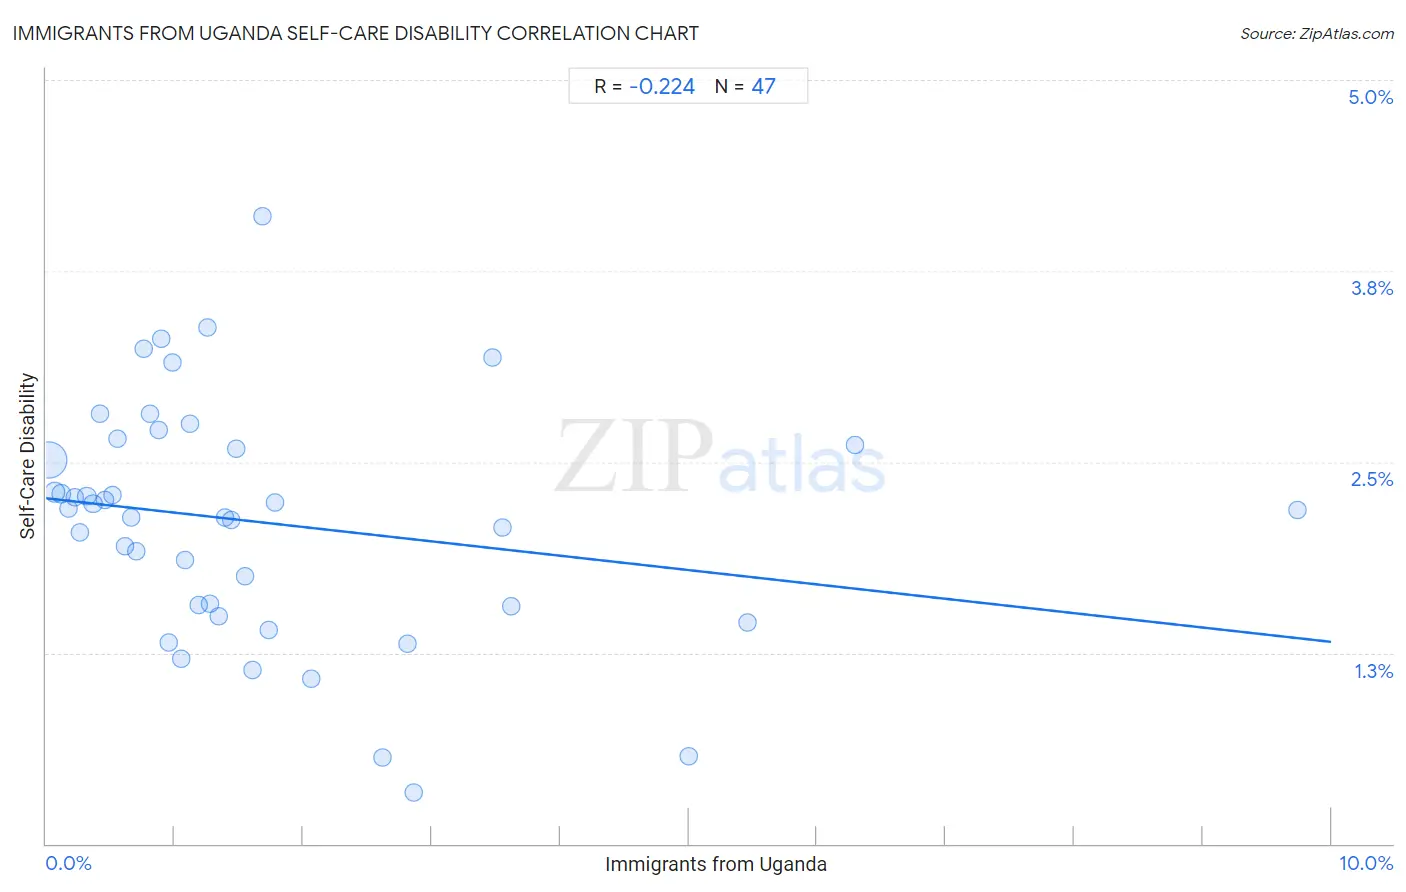
It is essential to understand that the correlation between the percentage of Immigrants from Uganda and percentage of population with self-care disability does not imply a direct cause-and-effect relationship. It remains uncertain whether the presence of Immigrants from Uganda influences an upward or downward trend in the level of percentage of population with self-care disability within an area, or if Immigrants from Uganda simply ended up residing in those areas with higher or lower levels of percentage of population with self-care disability due to other factors.

Demographics Similar to Immigrants from Uganda by Self-Care Disability

In terms of self-care disability, the demographic groups most similar to Immigrants from Uganda are Immigrants from Pakistan (2.3%, a difference of 0.050%), Immigrants from South Africa (2.3%, a difference of 0.090%), Immigrants from Sudan (2.3%, a difference of 0.10%), Norwegian (2.3%, a difference of 0.13%), and Iranian (2.3%, a difference of 0.17%).
DemographicsRating | RankSelf-Care Disability
Immigrants from Australia
99.9
/100
|
#35
Exceptional
2.3%
Immigrants from Lithuania
99.9
/100
|
#36
Exceptional
2.3%
Immigrants from Sweden
99.9
/100
|
#37
Exceptional
2.3%
Immigrants from Eastern Africa
99.9
/100
|
#38
Exceptional
2.3%
Immigrants from Bulgaria
99.8
/100
|
#39
Exceptional
2.3%
Iranians
99.8
/100
|
#40
Exceptional
2.3%
Immigrants from Sudan
99.8
/100
|
#41
Exceptional
2.3%
Immigrants from Uganda
99.8
/100
|
#42
Exceptional
2.3%
Immigrants from Pakistan
99.8
/100
|
#43
Exceptional
2.3%
Immigrants from South Africa
99.8
/100
|
#44
Exceptional
2.3%
Norwegians
99.8
/100
|
#45
Exceptional
2.3%
Czechs
99.8
/100
|
#46
Exceptional
2.3%
Jordanians
99.7
/100
|
#47
Exceptional
2.3%
Immigrants from Malaysia
99.7
/100
|
#48
Exceptional
2.3%
Latvians
99.7
/100
|
#49
Exceptional
2.3%

Immigrants from Uganda Self-Care Disability Correlation Summary

MeasurementImmigrants from Uganda DataSelf-Care Disability Data
Minimum0.016%0.33%
Maximum9.7%4.1%
Range9.7%3.8%
Mean1.7%2.1%
Median1.1%2.2%
Interquartile 25% (IQ1)0.56%1.6%
Interquartile 75% (IQ3)1.8%2.6%
Interquartile Range (IQR)1.2%1.1%
Standard Deviation (Sample)1.9%0.78%
Standard Deviation (Population)1.8%0.77%

Correlation Details

Immigrants from Uganda PercentileSample SizeSelf-Care Disability
[
0.0%
-
0.5%
]
0.016%
94,909,9272.5%
[
0.0%
-
0.5%
]
0.068%
15,618,4522.3%
[
0.0%
-
0.5%
]
0.12%
6,158,9562.3%
[
0.0%
-
0.5%
]
0.17%
2,271,6352.2%
[
0.0%
-
0.5%
]
0.22%
2,328,2152.3%
[
0.0%
-
0.5%
]
0.26%
1,184,2302.0%
[
0.0%
-
0.5%
]
0.32%
808,1072.3%
[
0.0%
-
0.5%
]
0.36%
492,3262.2%
[
0.0%
-
0.5%
]
0.42%
295,4012.8%
[
0.0%
-
0.5%
]
0.46%
485,3872.2%
[
0.5%
-
1.0%
]
0.51%
44,1862.3%
[
0.5%
-
1.0%
]
0.56%
226,5262.6%
[
0.5%
-
1.0%
]
0.62%
215,5061.9%
[
0.5%
-
1.0%
]
0.66%
223,5952.1%
[
0.5%
-
1.0%
]
0.70%
95,7501.9%
[
0.5%
-
1.0%
]
0.76%
43,9963.2%
[
0.5%
-
1.0%
]
0.81%
79,0872.8%
[
0.5%
-
1.0%
]
0.87%
12,7062.7%
[
0.5%
-
1.0%
]
0.89%
49,6633.3%
[
0.5%
-
1.0%
]
0.95%
16,1121.3%
[
0.5%
-
1.0%
]
0.99%
5,8873.1%
[
1.0%
-
1.5%
]
1.05%
4,0971.2%
[
1.0%
-
1.5%
]
1.08%
69,5241.9%
[
1.0%
-
1.5%
]
1.12%
32,7612.8%
[
1.0%
-
1.5%
]
1.18%
42,7851.6%
[
1.0%
-
1.5%
]
1.26%
13,5163.4%
[
1.0%
-
1.5%
]
1.27%
14,5531.6%
[
1.0%
-
1.5%
]
1.34%
68,8921.5%
[
1.0%
-
1.5%
]
1.39%
5,0182.1%
[
1.0%
-
1.5%
]
1.44%
1,5332.1%
[
1.0%
-
1.5%
]
1.48%
12,3552.6%
[
1.5%
-
2.0%
]
1.55%
23,0811.8%
[
1.5%
-
2.0%
]
1.60%
12,1081.1%
[
1.5%
-
2.0%
]
1.68%
2384.1%
[
1.5%
-
2.0%
]
1.73%
9,4151.4%
[
1.5%
-
2.0%
]
1.78%
3,1382.2%
[
2.0%
-
2.5%
]
2.07%
1,2101.1%
[
2.5%
-
3.0%
]
2.62%
5,4620.56%
[
2.5%
-
3.0%
]
2.81%
6041.3%
[
2.5%
-
3.0%
]
2.86%
3150.33%
[
3.0%
-
3.5%
]
3.47%
2,2743.2%
[
3.5%
-
4.0%
]
3.55%
3382.1%
[
3.5%
-
4.0%
]
3.62%
15,8301.6%
[
5.0%
-
5.5%
]
5.00%
1800.57%
[
5.0%
-
5.5%
]
5.46%
26,6841.4%
[
6.0%
-
6.5%
]
6.29%
1,3032.6%
[
9.5%
-
10.0%
]
9.74%
8422.2%