Immigrants from Uganda 2 or more Vehicles in Household

COMPARE

Immigrants from Uganda
Race
Ancestry
AfghanAfricanAlaska NativeAlaskan AthabascanAlbanianAleutAlsatianAmericanApacheArabArapahoArgentineanArmenianAssyrian/Chaldean/SyriacAustralianAustrianBahamianBangladeshiBarbadianBasqueBelgianBelizeanBermudanBhutaneseBlackfeetBolivianBrazilianBritishBritish West IndianBulgarianBurmeseCajunCambodianCanadianCape VerdeanCarpatho RusynCelticCentral AmericanCentral American IndianCherokeeCheyenneChickasawChileanChineseChippewaChoctawColombianColvilleComancheCosta RicanCreeCreekCroatianCrowCubanCypriotCzechCzechoslovakianDanishDelawareDominicanDutchDutch West IndianEastern EuropeanEcuadorianEgyptianEnglishEstonianEthiopianEuropeanFijianFilipinoFinnishFrenchFrench American IndianFrench CanadianGermanGerman RussianGhanaianGreekGuamanian/ChamorroGuatemalanGuyaneseHaitianHmongHonduranHopiHoumaHungarianIcelanderIndian (Asian)IndonesianInupiatIranianIraqiIrishIroquoisIsraeliItalianJamaicanJapaneseJordanianKenyanKiowaKoreanLaotianLatvianLebaneseLiberianLithuanianLumbeeLuxembourgerMacedonianMalaysianMalteseMarshalleseMenomineeMexicanMexican American IndianMongolianMoroccanNative HawaiianNavajoNepaleseNew ZealanderNicaraguanNigerianNorthern EuropeanNorwegianOkinawanOsageOttawaPaiutePakistaniPalestinianPanamanianParaguayanPennsylvania GermanPeruvianPimaPolishPortuguesePotawatomiPuebloPuerto RicanPuget Sound SalishRomanianRussianSalvadoranSamoanScandinavianScotch-IrishScottishSeminoleSenegaleseSerbianShoshoneSierra LeoneanSiouxSlavicSlovakSloveneSomaliSouth AfricanSouth AmericanSouth American IndianSoviet UnionSpaniardSpanishSpanish AmericanSpanish American IndianSri LankanSubsaharan AfricanSudaneseSwedishSwissSyrianTaiwaneseThaiTlingit-HaidaTohono O'OdhamTonganTrinidadian and TobagonianTsimshianTurkishU.S. Virgin IslanderUgandanUkrainianUruguayanUteVenezuelanVietnameseWelshWest IndianYakamaYaquiYugoslavianYumanYup'ikZimbabwean
Immigration
NonimmigrantsImmigrantsAfghanistanAfricaAlbaniaArgentinaArmeniaAsiaAustraliaAustriaBahamasBangladeshBarbadosBelarusBelgiumBelizeBoliviaBosnia and HerzegovinaBrazilBulgariaBurma/MyanmarCabo VerdeCambodiaCameroonCanadaCaribbeanCentral AmericaChileChinaColombiaCongoCosta RicaCroatiaCubaCzechoslovakiaDenmarkDominicaDominican RepublicEastern AfricaEastern AsiaEastern EuropeEcuadorEgyptEl SalvadorEnglandEritreaEthiopiaEuropeFijiFranceGermanyGhanaGreeceGrenadaGuatemalaGuyanaHaitiHondurasHong KongHungaryIndiaIndonesiaIranIraqIrelandIsraelItalyJamaicaJapanJordanKazakhstanKenyaKoreaKuwaitLaosLatin AmericaLatviaLebanonLiberiaLithuaniaMalaysiaMexicoMicronesiaMiddle AfricaMoldovaMoroccoNepalNetherlandsNicaraguaNigeriaNorth AmericaNorth MacedoniaNorthern AfricaNorthern EuropeNorwayOceaniaPakistanPanamaPeruPhilippinesPolandPortugalRomaniaRussiaSaudi ArabiaScotlandSenegalSerbiaSierra LeoneSingaporeSomaliaSouth AfricaSouth AmericaSouth Central AsiaSouth Eastern AsiaSouthern EuropeSpainSri LankaSt. Vincent and the GrenadinesSudanSwedenSwitzerlandSyriaTaiwanThailandTrinidad and TobagoTurkeyUgandaUkraineUruguayUzbekistanVenezuelaVietnamWest IndiesWestern AfricaWestern AsiaWestern EuropeYemenZaireZimbabweAzores
Select to Compare
Race
Ancestry
AfghanAfricanAlaska NativeAlaskan AthabascanAlbanianAleutAlsatianAmericanApacheArabArapahoArgentineanArmenianAssyrian/Chaldean/SyriacAustralianAustrianBahamianBangladeshiBarbadianBasqueBelgianBelizeanBermudanBhutaneseBlackfeetBolivianBrazilianBritishBritish West IndianBulgarianBurmeseCajunCambodianCanadianCape VerdeanCarpatho RusynCelticCentral AmericanCentral American IndianCherokeeCheyenneChickasawChileanChineseChippewaChoctawColombianColvilleComancheCosta RicanCreeCreekCroatianCrowCubanCypriotCzechCzechoslovakianDanishDelawareDominicanDutchDutch West IndianEastern EuropeanEcuadorianEgyptianEnglishEstonianEthiopianEuropeanFijianFilipinoFinnishFrenchFrench American IndianFrench CanadianGermanGerman RussianGhanaianGreekGuamanian/ChamorroGuatemalanGuyaneseHaitianHmongHonduranHopiHoumaHungarianIcelanderIndian (Asian)IndonesianInupiatIranianIraqiIrishIroquoisIsraeliItalianJamaicanJapaneseJordanianKenyanKiowaKoreanLaotianLatvianLebaneseLiberianLithuanianLumbeeLuxembourgerMacedonianMalaysianMalteseMarshalleseMenomineeMexicanMexican American IndianMongolianMoroccanNative HawaiianNavajoNepaleseNew ZealanderNicaraguanNigerianNorthern EuropeanNorwegianOkinawanOsageOttawaPaiutePakistaniPalestinianPanamanianParaguayanPennsylvania GermanPeruvianPimaPolishPortuguesePotawatomiPuebloPuerto RicanPuget Sound SalishRomanianRussianSalvadoranSamoanScandinavianScotch-IrishScottishSeminoleSenegaleseSerbianShoshoneSierra LeoneanSiouxSlavicSlovakSloveneSomaliSouth AfricanSouth AmericanSouth American IndianSoviet UnionSpaniardSpanishSpanish AmericanSpanish American IndianSri LankanSubsaharan AfricanSudaneseSwedishSwissSyrianTaiwaneseThaiTlingit-HaidaTohono O'OdhamTonganTrinidadian and TobagonianTsimshianTurkishU.S. Virgin IslanderUgandanUkrainianUruguayanUteVenezuelanVietnameseWelshWest IndianYakamaYaquiYugoslavianYumanYup'ikZimbabwean
Immigration
NonimmigrantsImmigrantsAfghanistanAfricaAlbaniaArgentinaArmeniaAsiaAustraliaAustriaBahamasBangladeshBarbadosBelarusBelgiumBelizeBoliviaBosnia and HerzegovinaBrazilBulgariaBurma/MyanmarCabo VerdeCambodiaCameroonCanadaCaribbeanCentral AmericaChileChinaColombiaCongoCosta RicaCroatiaCubaCzechoslovakiaDenmarkDominicaDominican RepublicEastern AfricaEastern AsiaEastern EuropeEcuadorEgyptEl SalvadorEnglandEritreaEthiopiaEuropeFijiFranceGermanyGhanaGreeceGrenadaGuatemalaGuyanaHaitiHondurasHong KongHungaryIndiaIndonesiaIranIraqIrelandIsraelItalyJamaicaJapanJordanKazakhstanKenyaKoreaKuwaitLaosLatin AmericaLatviaLebanonLiberiaLithuaniaMalaysiaMexicoMicronesiaMiddle AfricaMoldovaMoroccoNepalNetherlandsNicaraguaNigeriaNorth AmericaNorth MacedoniaNorthern AfricaNorthern EuropeNorwayOceaniaPakistanPanamaPeruPhilippinesPolandPortugalRomaniaRussiaSaudi ArabiaScotlandSenegalSerbiaSierra LeoneSingaporeSomaliaSouth AfricaSouth AmericaSouth Central AsiaSouth Eastern AsiaSouthern EuropeSpainSri LankaSt. Vincent and the GrenadinesSudanSwedenSwitzerlandSyriaTaiwanThailandTrinidad and TobagoTurkeyUkraineUruguayUzbekistanVenezuelaVietnamWest IndiesWestern AfricaWestern AsiaWestern EuropeYemenZaireZimbabweAzores
2 or more Vehicles in Household
Income
Poverty
Unemployment
Labor Participation
Family Structure
Vehicle Availability
Education Level
Disability

Immigrants from Uganda 2 or more Vehicles in Household
Fair

55.0%
2+ VEHICLES AVAILABLE
33.4/ 100
METRIC RATING
187th/ 347
METRIC RANK

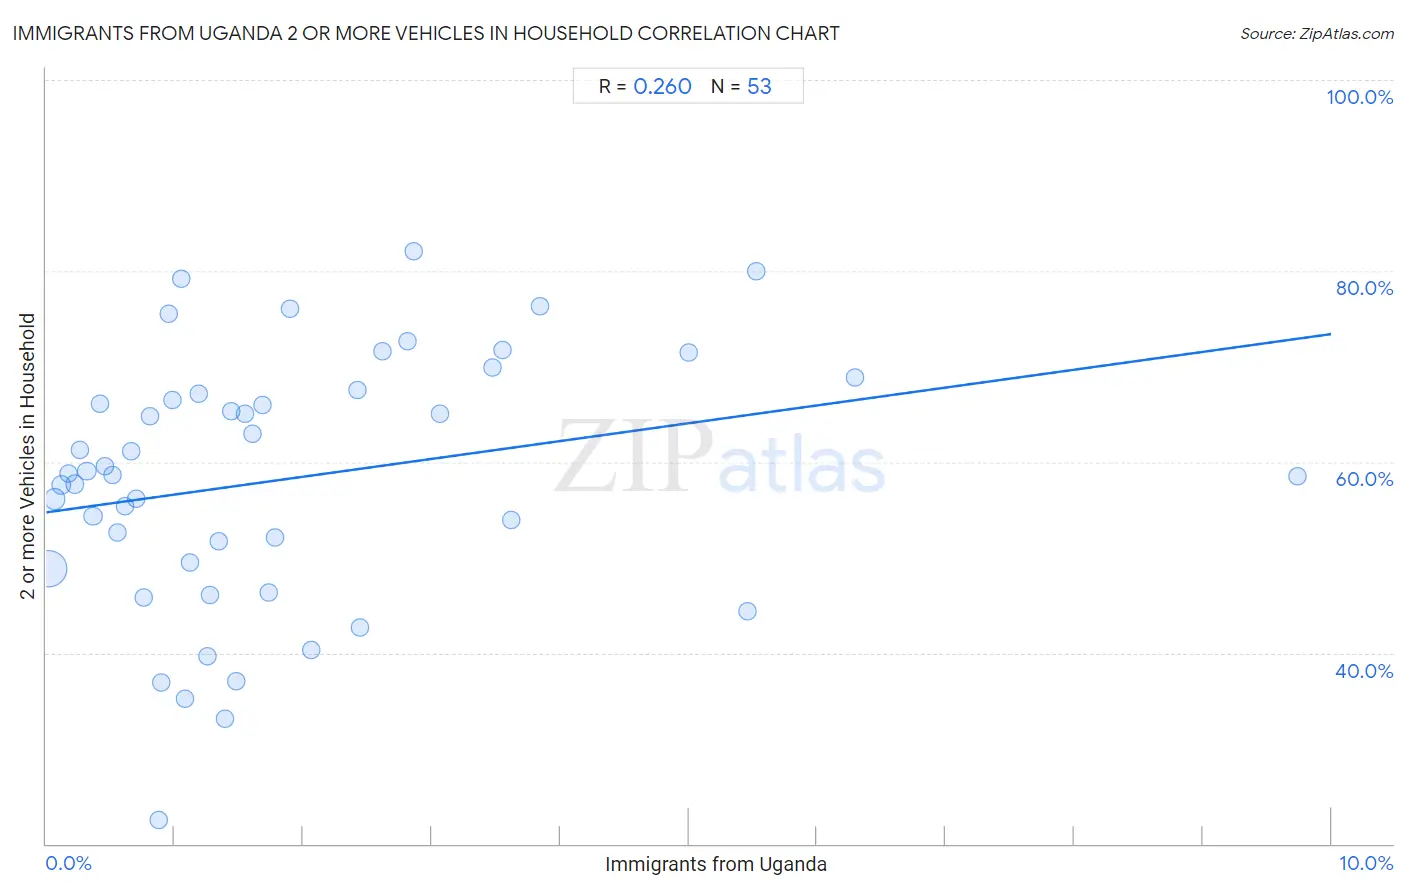
Immigrants from Uganda 2 or more Vehicles in Household Correlation Chart

The statistical analysis conducted on geographies consisting of 125,974,533 people shows a weak positive correlation between the proportion of Immigrants from Uganda and percentage of households with 2 or more vehicles available in the United States with a correlation coefficient (R) of 0.260 and weighted average of 55.0%. On average, for every 1% (one percent) increase in Immigrants from Uganda within a typical geography, there is an increase of 1.9% in percentage of households with 2 or more vehicles available.
Immigrants from Uganda 2 or more Vehicles in Household
It is essential to understand that the correlation between the percentage of Immigrants from Uganda and percentage of households with 2 or more vehicles available does not imply a direct cause-and-effect relationship. It remains uncertain whether the presence of Immigrants from Uganda influences an upward or downward trend in the level of percentage of households with 2 or more vehicles available within an area, or if Immigrants from Uganda simply ended up residing in those areas with higher or lower levels of percentage of households with 2 or more vehicles available due to other factors.

Demographics Similar to Immigrants from Uganda by 2 or more Vehicles in Household

In terms of 2 or more vehicles in household, the demographic groups most similar to Immigrants from Uganda are Peruvian (55.0%, a difference of 0.010%), Arab (55.0%, a difference of 0.11%), Marshallese (54.9%, a difference of 0.13%), Apache (55.1%, a difference of 0.15%), and Immigrants from Cameroon (55.1%, a difference of 0.17%).
DemographicsRating | Rank2 or more Vehicles in Household
Immigrants from Kenya
40.4
/100
|
#180
Average
55.1%
Immigrants from Micronesia
38.2
/100
|
#181
Fair
55.1%
Cree
38.2
/100
|
#182
Fair
55.1%
Immigrants from Cameroon
37.3
/100
|
#183
Fair
55.1%
Apache
36.7
/100
|
#184
Fair
55.1%
Arabs
35.9
/100
|
#185
Fair
55.0%
Peruvians
33.7
/100
|
#186
Fair
55.0%
Immigrants from Uganda
33.4
/100
|
#187
Fair
55.0%
Marshallese
30.5
/100
|
#188
Fair
54.9%
Eastern Europeans
27.5
/100
|
#189
Fair
54.8%
Russians
26.3
/100
|
#190
Fair
54.8%
Immigrants
25.0
/100
|
#191
Fair
54.7%
Immigrants from Romania
23.8
/100
|
#192
Fair
54.7%
Immigrants from Japan
23.4
/100
|
#193
Fair
54.7%
Central Americans
23.0
/100
|
#194
Fair
54.7%

Immigrants from Uganda 2 or more Vehicles in Household Correlation Summary

MeasurementImmigrants from Uganda Data2 or more Vehicles in Household Data
Minimum0.016%22.5%
Maximum9.7%82.0%
Range9.7%59.5%
Mean1.9%58.2%
Median1.3%58.8%
Interquartile 25% (IQ1)0.64%49.1%
Interquartile 75% (IQ3)2.5%67.3%
Interquartile Range (IQR)1.9%18.2%
Standard Deviation (Sample)1.9%13.3%
Standard Deviation (Population)1.8%13.2%

Correlation Details

Immigrants from Uganda PercentileSample Size2 or more Vehicles in Household
[
0.0%
-
0.5%
]
0.016%
94,907,68448.8%
[
0.0%
-
0.5%
]
0.068%
15,618,45256.1%
[
0.0%
-
0.5%
]
0.12%
6,167,58757.5%
[
0.0%
-
0.5%
]
0.17%
2,274,78458.8%
[
0.0%
-
0.5%
]
0.22%
2,340,88857.7%
[
0.0%
-
0.5%
]
0.26%
1,186,35261.2%
[
0.0%
-
0.5%
]
0.32%
808,10759.0%
[
0.0%
-
0.5%
]
0.36%
492,32654.3%
[
0.0%
-
0.5%
]
0.42%
295,40166.0%
[
0.0%
-
0.5%
]
0.46%
485,38759.5%
[
0.5%
-
1.0%
]
0.51%
44,18658.7%
[
0.5%
-
1.0%
]
0.56%
226,52652.6%
[
0.5%
-
1.0%
]
0.62%
215,50655.4%
[
0.5%
-
1.0%
]
0.66%
224,51861.1%
[
0.5%
-
1.0%
]
0.70%
95,75056.1%
[
0.5%
-
1.0%
]
0.76%
43,99645.8%
[
0.5%
-
1.0%
]
0.81%
79,08764.8%
[
0.5%
-
1.0%
]
0.87%
12,70622.5%
[
0.5%
-
1.0%
]
0.89%
49,66336.9%
[
0.5%
-
1.0%
]
0.95%
16,11275.5%
[
0.5%
-
1.0%
]
0.99%
5,88766.5%
[
1.0%
-
1.5%
]
1.05%
4,09779.2%
[
1.0%
-
1.5%
]
1.08%
69,52435.1%
[
1.0%
-
1.5%
]
1.12%
32,76149.5%
[
1.0%
-
1.5%
]
1.18%
43,20867.1%
[
1.0%
-
1.5%
]
1.26%
13,51639.7%
[
1.0%
-
1.5%
]
1.27%
14,55346.1%
[
1.0%
-
1.5%
]
1.34%
68,89251.7%
[
1.0%
-
1.5%
]
1.39%
5,01833.1%
[
1.0%
-
1.5%
]
1.44%
1,53365.3%
[
1.0%
-
1.5%
]
1.48%
12,35537.0%
[
1.5%
-
2.0%
]
1.55%
23,08165.0%
[
1.5%
-
2.0%
]
1.60%
12,10862.9%
[
1.5%
-
2.0%
]
1.68%
23866.0%
[
1.5%
-
2.0%
]
1.73%
9,41546.4%
[
1.5%
-
2.0%
]
1.78%
3,19452.1%
[
1.5%
-
2.0%
]
1.90%
2,90076.0%
[
2.0%
-
2.5%
]
2.07%
1,21040.3%
[
2.0%
-
2.5%
]
2.42%
66067.5%
[
2.0%
-
2.5%
]
2.45%
3,88442.6%
[
2.5%
-
3.0%
]
2.62%
5,46271.6%
[
2.5%
-
3.0%
]
2.81%
60472.7%
[
2.5%
-
3.0%
]
2.86%
31582.0%
[
3.0%
-
3.5%
]
3.07%
1,01165.0%
[
3.0%
-
3.5%
]
3.47%
5,62269.9%
[
3.5%
-
4.0%
]
3.55%
33871.7%
[
3.5%
-
4.0%
]
3.62%
15,83053.9%
[
3.5%
-
4.0%
]
3.84%
2,24176.3%
[
5.0%
-
5.5%
]
5.00%
18071.4%
[
5.0%
-
5.5%
]
5.46%
26,68444.4%
[
5.5%
-
6.0%
]
5.53%
1,04980.0%
[
6.0%
-
6.5%
]
6.29%
1,30368.8%
[
9.5%
-
10.0%
]
9.74%
84258.6%