Immigrants from Uganda Married-Couple Family Poverty

COMPARE

Immigrants from Uganda
Race
Ancestry
AfghanAfricanAlaska NativeAlaskan AthabascanAlbanianAleutAlsatianAmericanApacheArabArapahoArgentineanArmenianAssyrian/Chaldean/SyriacAustralianAustrianBahamianBangladeshiBarbadianBasqueBelgianBelizeanBermudanBhutaneseBlackfeetBolivianBrazilianBritishBritish West IndianBulgarianBurmeseCajunCambodianCanadianCape VerdeanCarpatho RusynCelticCentral AmericanCentral American IndianCherokeeCheyenneChickasawChileanChineseChippewaChoctawColombianColvilleComancheCosta RicanCreeCreekCroatianCrowCubanCypriotCzechCzechoslovakianDanishDelawareDominicanDutchDutch West IndianEastern EuropeanEcuadorianEgyptianEnglishEstonianEthiopianEuropeanFijianFilipinoFinnishFrenchFrench American IndianFrench CanadianGermanGerman RussianGhanaianGreekGuamanian/ChamorroGuatemalanGuyaneseHaitianHmongHonduranHopiHoumaHungarianIcelanderIndian (Asian)IndonesianInupiatIranianIraqiIrishIroquoisIsraeliItalianJamaicanJapaneseJordanianKenyanKiowaKoreanLaotianLatvianLebaneseLiberianLithuanianLumbeeLuxembourgerMacedonianMalaysianMalteseMarshalleseMenomineeMexicanMexican American IndianMongolianMoroccanNative HawaiianNavajoNepaleseNew ZealanderNicaraguanNigerianNorthern EuropeanNorwegianOkinawanOsageOttawaPaiutePakistaniPalestinianPanamanianParaguayanPennsylvania GermanPeruvianPimaPolishPortuguesePotawatomiPuebloPuerto RicanPuget Sound SalishRomanianRussianSalvadoranSamoanScandinavianScotch-IrishScottishSeminoleSenegaleseSerbianShoshoneSierra LeoneanSiouxSlavicSlovakSloveneSomaliSouth AfricanSouth AmericanSouth American IndianSoviet UnionSpaniardSpanishSpanish AmericanSpanish American IndianSri LankanSubsaharan AfricanSudaneseSwedishSwissSyrianTaiwaneseThaiTlingit-HaidaTohono O'OdhamTonganTrinidadian and TobagonianTsimshianTurkishU.S. Virgin IslanderUgandanUkrainianUruguayanUteVenezuelanVietnameseWelshWest IndianYakamaYaquiYugoslavianYumanYup'ikZimbabwean
Immigration
NonimmigrantsImmigrantsAfghanistanAfricaAlbaniaArgentinaArmeniaAsiaAustraliaAustriaBahamasBangladeshBarbadosBelarusBelgiumBelizeBoliviaBosnia and HerzegovinaBrazilBulgariaBurma/MyanmarCabo VerdeCambodiaCameroonCanadaCaribbeanCentral AmericaChileChinaColombiaCongoCosta RicaCroatiaCubaCzechoslovakiaDenmarkDominicaDominican RepublicEastern AfricaEastern AsiaEastern EuropeEcuadorEgyptEl SalvadorEnglandEritreaEthiopiaEuropeFijiFranceGermanyGhanaGreeceGrenadaGuatemalaGuyanaHaitiHondurasHong KongHungaryIndiaIndonesiaIranIraqIrelandIsraelItalyJamaicaJapanJordanKazakhstanKenyaKoreaKuwaitLaosLatin AmericaLatviaLebanonLiberiaLithuaniaMalaysiaMexicoMicronesiaMiddle AfricaMoldovaMoroccoNepalNetherlandsNicaraguaNigeriaNorth AmericaNorth MacedoniaNorthern AfricaNorthern EuropeNorwayOceaniaPakistanPanamaPeruPhilippinesPolandPortugalRomaniaRussiaSaudi ArabiaScotlandSenegalSerbiaSierra LeoneSingaporeSomaliaSouth AfricaSouth AmericaSouth Central AsiaSouth Eastern AsiaSouthern EuropeSpainSri LankaSt. Vincent and the GrenadinesSudanSwedenSwitzerlandSyriaTaiwanThailandTrinidad and TobagoTurkeyUgandaUkraineUruguayUzbekistanVenezuelaVietnamWest IndiesWestern AfricaWestern AsiaWestern EuropeYemenZaireZimbabweAzores
Select to Compare
Race
Ancestry
AfghanAfricanAlaska NativeAlaskan AthabascanAlbanianAleutAlsatianAmericanApacheArabArapahoArgentineanArmenianAssyrian/Chaldean/SyriacAustralianAustrianBahamianBangladeshiBarbadianBasqueBelgianBelizeanBermudanBhutaneseBlackfeetBolivianBrazilianBritishBritish West IndianBulgarianBurmeseCajunCambodianCanadianCape VerdeanCarpatho RusynCelticCentral AmericanCentral American IndianCherokeeCheyenneChickasawChileanChineseChippewaChoctawColombianColvilleComancheCosta RicanCreeCreekCroatianCrowCubanCypriotCzechCzechoslovakianDanishDelawareDominicanDutchDutch West IndianEastern EuropeanEcuadorianEgyptianEnglishEstonianEthiopianEuropeanFijianFilipinoFinnishFrenchFrench American IndianFrench CanadianGermanGerman RussianGhanaianGreekGuamanian/ChamorroGuatemalanGuyaneseHaitianHmongHonduranHopiHoumaHungarianIcelanderIndian (Asian)IndonesianInupiatIranianIraqiIrishIroquoisIsraeliItalianJamaicanJapaneseJordanianKenyanKiowaKoreanLaotianLatvianLebaneseLiberianLithuanianLumbeeLuxembourgerMacedonianMalaysianMalteseMarshalleseMenomineeMexicanMexican American IndianMongolianMoroccanNative HawaiianNavajoNepaleseNew ZealanderNicaraguanNigerianNorthern EuropeanNorwegianOkinawanOsageOttawaPaiutePakistaniPalestinianPanamanianParaguayanPennsylvania GermanPeruvianPimaPolishPortuguesePotawatomiPuebloPuerto RicanPuget Sound SalishRomanianRussianSalvadoranSamoanScandinavianScotch-IrishScottishSeminoleSenegaleseSerbianShoshoneSierra LeoneanSiouxSlavicSlovakSloveneSomaliSouth AfricanSouth AmericanSouth American IndianSoviet UnionSpaniardSpanishSpanish AmericanSpanish American IndianSri LankanSubsaharan AfricanSudaneseSwedishSwissSyrianTaiwaneseThaiTlingit-HaidaTohono O'OdhamTonganTrinidadian and TobagonianTsimshianTurkishU.S. Virgin IslanderUgandanUkrainianUruguayanUteVenezuelanVietnameseWelshWest IndianYakamaYaquiYugoslavianYumanYup'ikZimbabwean
Immigration
NonimmigrantsImmigrantsAfghanistanAfricaAlbaniaArgentinaArmeniaAsiaAustraliaAustriaBahamasBangladeshBarbadosBelarusBelgiumBelizeBoliviaBosnia and HerzegovinaBrazilBulgariaBurma/MyanmarCabo VerdeCambodiaCameroonCanadaCaribbeanCentral AmericaChileChinaColombiaCongoCosta RicaCroatiaCubaCzechoslovakiaDenmarkDominicaDominican RepublicEastern AfricaEastern AsiaEastern EuropeEcuadorEgyptEl SalvadorEnglandEritreaEthiopiaEuropeFijiFranceGermanyGhanaGreeceGrenadaGuatemalaGuyanaHaitiHondurasHong KongHungaryIndiaIndonesiaIranIraqIrelandIsraelItalyJamaicaJapanJordanKazakhstanKenyaKoreaKuwaitLaosLatin AmericaLatviaLebanonLiberiaLithuaniaMalaysiaMexicoMicronesiaMiddle AfricaMoldovaMoroccoNepalNetherlandsNicaraguaNigeriaNorth AmericaNorth MacedoniaNorthern AfricaNorthern EuropeNorwayOceaniaPakistanPanamaPeruPhilippinesPolandPortugalRomaniaRussiaSaudi ArabiaScotlandSenegalSerbiaSierra LeoneSingaporeSomaliaSouth AfricaSouth AmericaSouth Central AsiaSouth Eastern AsiaSouthern EuropeSpainSri LankaSt. Vincent and the GrenadinesSudanSwedenSwitzerlandSyriaTaiwanThailandTrinidad and TobagoTurkeyUkraineUruguayUzbekistanVenezuelaVietnamWest IndiesWestern AfricaWestern AsiaWestern EuropeYemenZaireZimbabweAzores
Married-Couple Family Poverty
Income
Poverty
Unemployment
Labor Participation
Family Structure
Vehicle Availability
Education Level
Disability

Immigrants from Uganda Married-Couple Family Poverty
Average

5.2%
POVERTY | MARRIED-COUPLE FAMILIES
54.9/ 100
METRIC RATING
168th/ 347
METRIC RANK

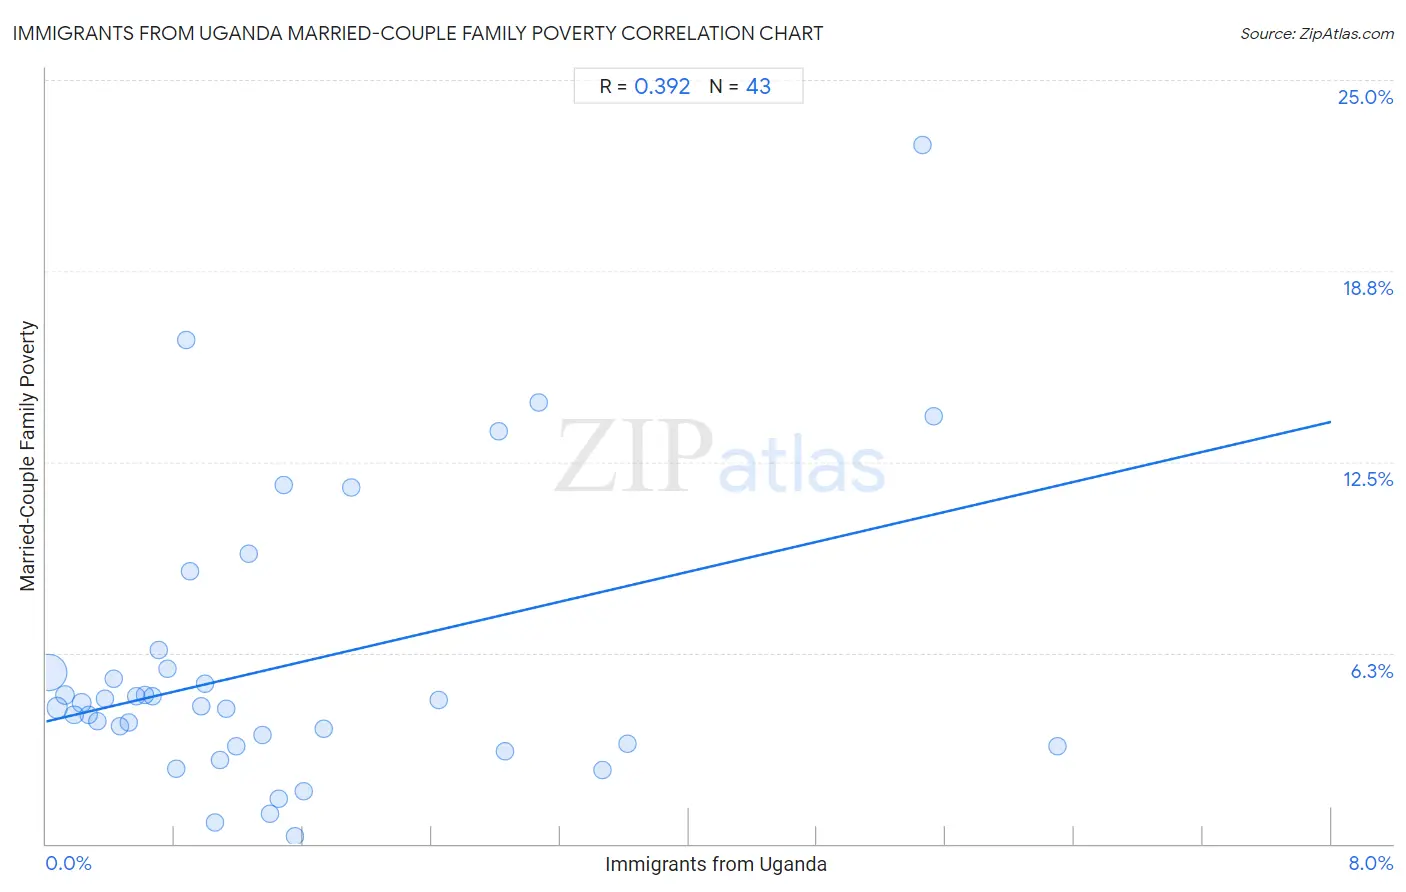
Immigrants from Uganda Married-Couple Family Poverty Correlation Chart

The statistical analysis conducted on geographies consisting of 125,662,794 people shows a mild positive correlation between the proportion of Immigrants from Uganda and poverty level among married-couple families in the United States with a correlation coefficient (R) of 0.392 and weighted average of 5.2%. On average, for every 1% (one percent) increase in Immigrants from Uganda within a typical geography, there is an increase of 1.2% in poverty level among married-couple families.
Immigrants from Uganda Married-Couple Family Poverty
It is essential to understand that the correlation between the percentage of Immigrants from Uganda and poverty level among married-couple families does not imply a direct cause-and-effect relationship. It remains uncertain whether the presence of Immigrants from Uganda influences an upward or downward trend in the level of poverty level among married-couple families within an area, or if Immigrants from Uganda simply ended up residing in those areas with higher or lower levels of poverty level among married-couple families due to other factors.

Demographics Similar to Immigrants from Uganda by Married-Couple Family Poverty

In terms of married-couple family poverty, the demographic groups most similar to Immigrants from Uganda are Ottawa (5.2%, a difference of 0.040%), Immigrants from Argentina (5.2%, a difference of 0.060%), Bermudan (5.2%, a difference of 0.23%), Immigrants from Northern Africa (5.2%, a difference of 0.41%), and Alsatian (5.2%, a difference of 0.43%).
DemographicsRating | RankMarried-Couple Family Poverty
Ethiopians
68.1
/100
|
#161
Good
5.1%
Immigrants from Jordan
66.5
/100
|
#162
Good
5.1%
Sierra Leoneans
64.1
/100
|
#163
Good
5.1%
Hawaiians
62.3
/100
|
#164
Good
5.1%
Immigrants from Malaysia
62.2
/100
|
#165
Good
5.1%
Paraguayans
61.5
/100
|
#166
Good
5.1%
Costa Ricans
61.5
/100
|
#167
Good
5.1%
Immigrants from Uganda
54.9
/100
|
#168
Average
5.2%
Ottawa
54.5
/100
|
#169
Average
5.2%
Immigrants from Argentina
54.4
/100
|
#170
Average
5.2%
Bermudans
52.9
/100
|
#171
Average
5.2%
Immigrants from Northern Africa
51.3
/100
|
#172
Average
5.2%
Alsatians
51.2
/100
|
#173
Average
5.2%
Immigrants from Eastern Africa
50.0
/100
|
#174
Average
5.2%
Marshallese
47.9
/100
|
#175
Average
5.2%

Immigrants from Uganda Married-Couple Family Poverty Correlation Summary

MeasurementImmigrants from Uganda DataMarried-Couple Family Poverty Data
Minimum0.016%0.25%
Maximum6.3%22.9%
Range6.3%22.6%
Mean1.5%5.8%
Median1.0%4.5%
Interquartile 25% (IQ1)0.51%3.2%
Interquartile 75% (IQ3)1.7%5.7%
Interquartile Range (IQR)1.2%2.5%
Standard Deviation (Sample)1.5%4.7%
Standard Deviation (Population)1.5%4.6%

Correlation Details

Immigrants from Uganda PercentileSample SizeMarried-Couple Family Poverty
[
0.0%
-
0.5%
]
0.016%
94,852,5345.6%
[
0.0%
-
0.5%
]
0.068%
15,579,0274.5%
[
0.0%
-
0.5%
]
0.12%
6,144,9744.9%
[
0.0%
-
0.5%
]
0.17%
2,263,6654.2%
[
0.0%
-
0.5%
]
0.22%
2,305,5334.6%
[
0.0%
-
0.5%
]
0.26%
1,178,0444.2%
[
0.0%
-
0.5%
]
0.32%
755,5994.0%
[
0.0%
-
0.5%
]
0.37%
477,7894.8%
[
0.0%
-
0.5%
]
0.42%
295,4015.4%
[
0.0%
-
0.5%
]
0.46%
482,4593.8%
[
0.5%
-
1.0%
]
0.51%
42,6274.0%
[
0.5%
-
1.0%
]
0.56%
225,6074.8%
[
0.5%
-
1.0%
]
0.62%
215,5064.9%
[
0.5%
-
1.0%
]
0.66%
215,4984.8%
[
0.5%
-
1.0%
]
0.70%
95,7506.3%
[
0.5%
-
1.0%
]
0.76%
40,4895.7%
[
0.5%
-
1.0%
]
0.81%
69,4852.4%
[
0.5%
-
1.0%
]
0.87%
12,70616.5%
[
0.5%
-
1.0%
]
0.89%
46,5658.9%
[
0.5%
-
1.0%
]
0.97%
6,8234.5%
[
0.5%
-
1.0%
]
0.99%
5,8875.2%
[
1.0%
-
1.5%
]
1.05%
4,0970.68%
[
1.0%
-
1.5%
]
1.08%
69,5242.7%
[
1.0%
-
1.5%
]
1.12%
32,7614.4%
[
1.0%
-
1.5%
]
1.18%
42,7853.2%
[
1.0%
-
1.5%
]
1.26%
13,5169.5%
[
1.0%
-
1.5%
]
1.34%
68,8923.6%
[
1.0%
-
1.5%
]
1.39%
5,0180.97%
[
1.0%
-
1.5%
]
1.45%
3461.5%
[
1.0%
-
1.5%
]
1.48%
12,35511.7%
[
1.5%
-
2.0%
]
1.55%
23,0810.25%
[
1.5%
-
2.0%
]
1.60%
12,1081.7%
[
1.5%
-
2.0%
]
1.73%
9,4153.7%
[
1.5%
-
2.0%
]
1.90%
2,90011.6%
[
2.0%
-
2.5%
]
2.45%
3,8844.7%
[
2.5%
-
3.0%
]
2.81%
60413.5%
[
2.5%
-
3.0%
]
2.86%
3153.0%
[
3.0%
-
3.5%
]
3.07%
1,01114.4%
[
3.0%
-
3.5%
]
3.46%
3,3482.4%
[
3.5%
-
4.0%
]
3.62%
15,8303.3%
[
5.0%
-
5.5%
]
5.46%
26,68422.9%
[
5.5%
-
6.0%
]
5.53%
1,04914.0%
[
6.0%
-
6.5%
]
6.29%
1,3033.2%