Immigrants from Portugal Self-Care Disability
COMPARE
Immigrants from Portugal
Select to Compare
Self-Care Disability
Immigrants from Portugal Self-Care Disability
2.8%
SELF-CARE DISABILITY
0.0/ 100
METRIC RATING
296th/ 347
METRIC RANK
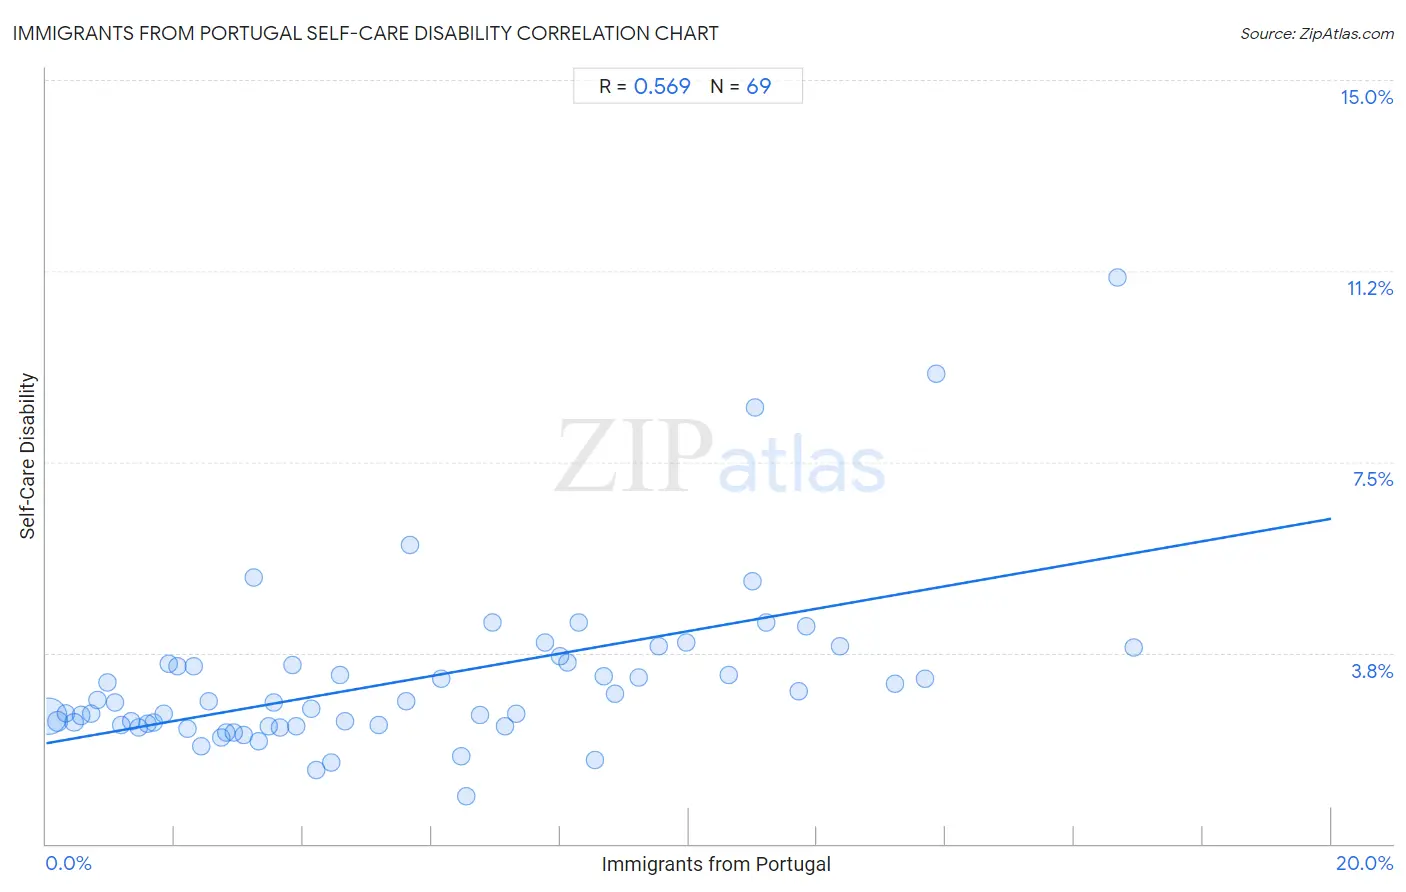
Immigrants from Portugal Self-Care Disability Correlation Chart
The statistical analysis conducted on geographies consisting of 174,707,428 people shows a substantial positive correlation between the proportion of Immigrants from Portugal and percentage of population with self-care disability in the United States with a correlation coefficient (R) of 0.569 and weighted average of 2.8%. On average, for every 1% (one percent) increase in Immigrants from Portugal within a typical geography, there is an increase of 0.22% in percentage of population with self-care disability.
It is essential to understand that the correlation between the percentage of Immigrants from Portugal and percentage of population with self-care disability does not imply a direct cause-and-effect relationship. It remains uncertain whether the presence of Immigrants from Portugal influences an upward or downward trend in the level of percentage of population with self-care disability within an area, or if Immigrants from Portugal simply ended up residing in those areas with higher or lower levels of percentage of population with self-care disability due to other factors.
Demographics Similar to Immigrants from Portugal by Self-Care Disability
In terms of self-care disability, the demographic groups most similar to Immigrants from Portugal are West Indian (2.8%, a difference of 0.090%), American (2.8%, a difference of 0.20%), Immigrants from Guyana (2.8%, a difference of 0.29%), Barbadian (2.7%, a difference of 0.43%), and Belizean (2.7%, a difference of 0.57%).
| Demographics | Rating | Rank | Self-Care Disability |
| Africans | 0.0 /100 | #289 | Tragic 2.7% |
| Cubans | 0.0 /100 | #290 | Tragic 2.7% |
| Guyanese | 0.0 /100 | #291 | Tragic 2.7% |
| Central American Indians | 0.0 /100 | #292 | Tragic 2.7% |
| Belizeans | 0.0 /100 | #293 | Tragic 2.7% |
| Blackfeet | 0.0 /100 | #294 | Tragic 2.7% |
| Barbadians | 0.0 /100 | #295 | Tragic 2.7% |
| Immigrants from Portugal | 0.0 /100 | #296 | Tragic 2.8% |
| West Indians | 0.0 /100 | #297 | Tragic 2.8% |
| Americans | 0.0 /100 | #298 | Tragic 2.8% |
| Immigrants from Guyana | 0.0 /100 | #299 | Tragic 2.8% |
| Immigrants from Fiji | 0.0 /100 | #300 | Tragic 2.8% |
| Pima | 0.0 /100 | #301 | Tragic 2.8% |
| Immigrants from St. Vincent and the Grenadines | 0.0 /100 | #302 | Tragic 2.8% |
| Immigrants from Belize | 0.0 /100 | #303 | Tragic 2.8% |
Immigrants from Portugal Self-Care Disability Correlation Summary
| Measurement | Immigrants from Portugal Data | Self-Care Disability Data |
| Minimum | 0.034% | 0.93% |
| Maximum | 16.9% | 11.1% |
| Range | 16.9% | 10.2% |
| Mean | 5.7% | 3.2% |
| Median | 4.4% | 2.8% |
| Interquartile 25% (IQ1) | 2.1% | 2.3% |
| Interquartile 75% (IQ3) | 8.6% | 3.6% |
| Interquartile Range (IQR) | 6.5% | 1.2% |
| Standard Deviation (Sample) | 4.3% | 1.7% |
| Standard Deviation (Population) | 4.3% | 1.7% |
Correlation Details
| Immigrants from Portugal Percentile | Sample Size | Self-Care Disability |
[ 0.0% - 0.5% ] 0.034% | 139,025,267 | 2.5% |
[ 0.0% - 0.5% ] 0.18% | 16,707,219 | 2.4% |
[ 0.0% - 0.5% ] 0.30% | 5,411,114 | 2.6% |
[ 0.0% - 0.5% ] 0.43% | 3,127,253 | 2.4% |
[ 0.5% - 1.0% ] 0.55% | 2,573,954 | 2.5% |
[ 0.5% - 1.0% ] 0.69% | 1,311,209 | 2.6% |
[ 0.5% - 1.0% ] 0.80% | 636,355 | 2.8% |
[ 0.5% - 1.0% ] 0.95% | 669,343 | 3.2% |
[ 1.0% - 1.5% ] 1.06% | 686,009 | 2.8% |
[ 1.0% - 1.5% ] 1.17% | 308,907 | 2.3% |
[ 1.0% - 1.5% ] 1.33% | 474,601 | 2.4% |
[ 1.0% - 1.5% ] 1.45% | 319,929 | 2.3% |
[ 1.5% - 2.0% ] 1.58% | 197,755 | 2.4% |
[ 1.5% - 2.0% ] 1.68% | 220,487 | 2.4% |
[ 1.5% - 2.0% ] 1.82% | 362,744 | 2.6% |
[ 1.5% - 2.0% ] 1.91% | 103,165 | 3.5% |
[ 2.0% - 2.5% ] 2.05% | 343,717 | 3.5% |
[ 2.0% - 2.5% ] 2.20% | 215,673 | 2.3% |
[ 2.0% - 2.5% ] 2.29% | 26,676 | 3.5% |
[ 2.0% - 2.5% ] 2.41% | 120,839 | 1.9% |
[ 2.5% - 3.0% ] 2.53% | 163,270 | 2.8% |
[ 2.5% - 3.0% ] 2.72% | 31,505 | 2.1% |
[ 2.5% - 3.0% ] 2.80% | 184,081 | 2.2% |
[ 2.5% - 3.0% ] 2.92% | 101,839 | 2.2% |
[ 3.0% - 3.5% ] 3.07% | 83,553 | 2.1% |
[ 3.0% - 3.5% ] 3.23% | 13,154 | 5.2% |
[ 3.0% - 3.5% ] 3.31% | 77,292 | 2.0% |
[ 3.0% - 3.5% ] 3.46% | 37,993 | 2.3% |
[ 3.5% - 4.0% ] 3.54% | 90,831 | 2.8% |
[ 3.5% - 4.0% ] 3.65% | 16,296 | 2.3% |
[ 3.5% - 4.0% ] 3.84% | 17,048 | 3.5% |
[ 3.5% - 4.0% ] 3.89% | 16,427 | 2.3% |
[ 4.0% - 4.5% ] 4.12% | 43,579 | 2.6% |
[ 4.0% - 4.5% ] 4.20% | 32,704 | 1.5% |
[ 4.0% - 4.5% ] 4.44% | 64,636 | 1.6% |
[ 4.5% - 5.0% ] 4.58% | 111,351 | 3.3% |
[ 4.5% - 5.0% ] 4.64% | 3,620 | 2.4% |
[ 5.0% - 5.5% ] 5.17% | 82,314 | 2.3% |
[ 5.5% - 6.0% ] 5.61% | 196 | 2.8% |
[ 5.5% - 6.0% ] 5.67% | 2,436 | 5.9% |
[ 6.0% - 6.5% ] 6.16% | 86,201 | 3.2% |
[ 6.0% - 6.5% ] 6.45% | 10,466 | 1.7% |
[ 6.5% - 7.0% ] 6.53% | 337 | 0.93% |
[ 6.5% - 7.0% ] 6.74% | 11,966 | 2.5% |
[ 6.5% - 7.0% ] 6.95% | 5,572 | 4.4% |
[ 7.0% - 7.5% ] 7.15% | 1,581 | 2.3% |
[ 7.0% - 7.5% ] 7.31% | 12,072 | 2.5% |
[ 7.5% - 8.0% ] 7.76% | 100,620 | 3.9% |
[ 7.5% - 8.0% ] 8.00% | 21,383 | 3.7% |
[ 8.0% - 8.5% ] 8.11% | 47,012 | 3.6% |
[ 8.0% - 8.5% ] 8.29% | 16,286 | 4.4% |
[ 8.5% - 9.0% ] 8.54% | 56,696 | 1.6% |
[ 8.5% - 9.0% ] 8.68% | 26,474 | 3.3% |
[ 8.5% - 9.0% ] 8.86% | 27,548 | 3.0% |
[ 9.0% - 9.5% ] 9.22% | 25,084 | 3.3% |
[ 9.5% - 10.0% ] 9.53% | 18,445 | 3.9% |
[ 9.5% - 10.0% ] 9.96% | 562 | 4.0% |
[ 10.5% - 11.0% ] 10.61% | 12,465 | 3.3% |
[ 10.5% - 11.0% ] 11.00% | 30,558 | 5.1% |
[ 11.0% - 11.5% ] 11.03% | 263 | 8.6% |
[ 11.0% - 11.5% ] 11.21% | 93,638 | 4.4% |
[ 11.5% - 12.0% ] 11.71% | 8,763 | 3.0% |
[ 11.5% - 12.0% ] 11.82% | 17,164 | 4.3% |
[ 12.0% - 12.5% ] 12.36% | 26,807 | 3.9% |
[ 13.0% - 13.5% ] 13.22% | 21,742 | 3.2% |
[ 13.5% - 14.0% ] 13.68% | 6,484 | 3.2% |
[ 13.5% - 14.0% ] 13.85% | 130 | 9.2% |
[ 16.5% - 17.0% ] 16.67% | 108 | 11.1% |
[ 16.5% - 17.0% ] 16.93% | 4,660 | 3.9% |