Immigrants from Portugal GED/Equivalency
COMPARE
Immigrants from Portugal
Select to Compare
GED/Equivalency
Immigrants from Portugal GED/Equivalency
81.6%
GED/EQUIVALENCY
0.0/ 100
METRIC RATING
303rd/ 347
METRIC RANK
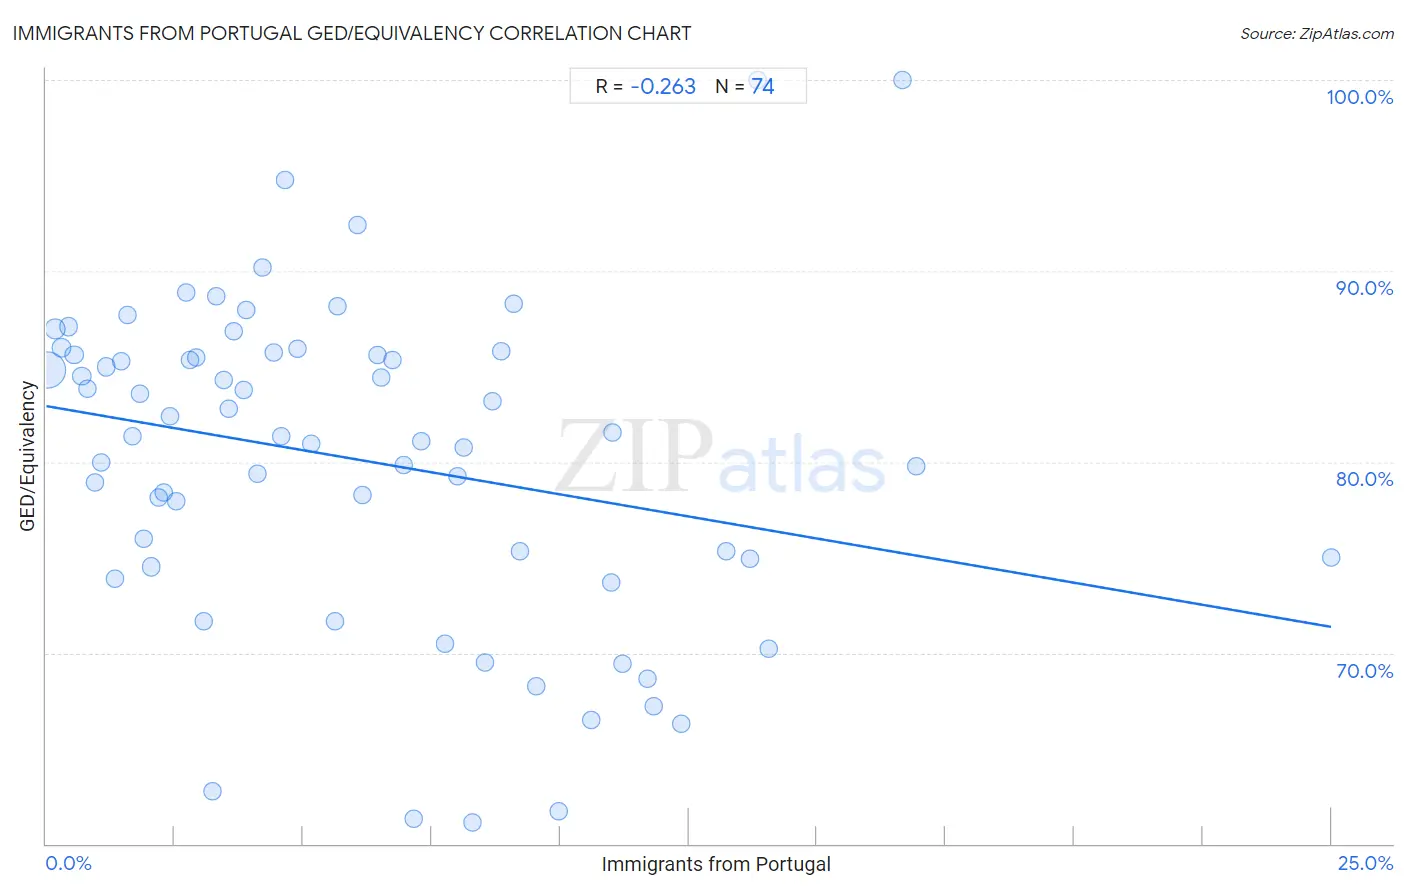
Immigrants from Portugal GED/Equivalency Correlation Chart
The statistical analysis conducted on geographies consisting of 174,792,669 people shows a weak negative correlation between the proportion of Immigrants from Portugal and percentage of population with at least ged/equivalency education in the United States with a correlation coefficient (R) of -0.263 and weighted average of 81.6%. On average, for every 1% (one percent) increase in Immigrants from Portugal within a typical geography, there is a decrease of 0.46% in percentage of population with at least ged/equivalency education.
It is essential to understand that the correlation between the percentage of Immigrants from Portugal and percentage of population with at least ged/equivalency education does not imply a direct cause-and-effect relationship. It remains uncertain whether the presence of Immigrants from Portugal influences an upward or downward trend in the level of percentage of population with at least ged/equivalency education within an area, or if Immigrants from Portugal simply ended up residing in those areas with higher or lower levels of percentage of population with at least ged/equivalency education due to other factors.
Demographics Similar to Immigrants from Portugal by GED/Equivalency
In terms of ged/equivalency, the demographic groups most similar to Immigrants from Portugal are Immigrants from Haiti (81.6%, a difference of 0.0%), Dutch West Indian (81.6%, a difference of 0.040%), Fijian (81.6%, a difference of 0.10%), Navajo (81.5%, a difference of 0.10%), and Ecuadorian (81.7%, a difference of 0.17%).
| Demographics | Rating | Rank | GED/Equivalency |
| Vietnamese | 0.0 /100 | #296 | Tragic 81.9% |
| Immigrants from Bangladesh | 0.0 /100 | #297 | Tragic 81.9% |
| Ute | 0.0 /100 | #298 | Tragic 81.8% |
| Ecuadorians | 0.0 /100 | #299 | Tragic 81.7% |
| Fijians | 0.0 /100 | #300 | Tragic 81.6% |
| Dutch West Indians | 0.0 /100 | #301 | Tragic 81.6% |
| Immigrants from Haiti | 0.0 /100 | #302 | Tragic 81.6% |
| Immigrants from Portugal | 0.0 /100 | #303 | Tragic 81.6% |
| Navajo | 0.0 /100 | #304 | Tragic 81.5% |
| Immigrants from Grenada | 0.0 /100 | #305 | Tragic 81.3% |
| Guyanese | 0.0 /100 | #306 | Tragic 81.3% |
| Immigrants from Dominica | 0.0 /100 | #307 | Tragic 81.1% |
| Puerto Ricans | 0.0 /100 | #308 | Tragic 81.1% |
| Immigrants from Ecuador | 0.0 /100 | #309 | Tragic 81.0% |
| Immigrants from Guyana | 0.0 /100 | #310 | Tragic 81.0% |
Immigrants from Portugal GED/Equivalency Correlation Summary
| Measurement | Immigrants from Portugal Data | GED/Equivalency Data |
| Minimum | 0.034% | 61.1% |
| Maximum | 25.0% | 100.0% |
| Range | 25.0% | 38.9% |
| Mean | 6.1% | 80.1% |
| Median | 4.8% | 81.3% |
| Interquartile 25% (IQ1) | 2.3% | 74.9% |
| Interquartile 75% (IQ3) | 8.9% | 85.6% |
| Interquartile Range (IQR) | 6.6% | 10.7% |
| Standard Deviation (Sample) | 4.8% | 8.5% |
| Standard Deviation (Population) | 4.8% | 8.4% |
Correlation Details
| Immigrants from Portugal Percentile | Sample Size | GED/Equivalency |
[ 0.0% - 0.5% ] 0.034% | 139,031,326 | 84.8% |
[ 0.0% - 0.5% ] 0.18% | 16,740,902 | 87.0% |
[ 0.0% - 0.5% ] 0.30% | 5,419,687 | 86.0% |
[ 0.0% - 0.5% ] 0.43% | 3,129,987 | 87.1% |
[ 0.5% - 1.0% ] 0.55% | 2,574,311 | 85.6% |
[ 0.5% - 1.0% ] 0.69% | 1,314,385 | 84.5% |
[ 0.5% - 1.0% ] 0.81% | 647,637 | 83.8% |
[ 0.5% - 1.0% ] 0.95% | 670,464 | 78.9% |
[ 1.0% - 1.5% ] 1.06% | 688,136 | 79.9% |
[ 1.0% - 1.5% ] 1.17% | 308,907 | 85.0% |
[ 1.0% - 1.5% ] 1.33% | 475,930 | 73.8% |
[ 1.0% - 1.5% ] 1.45% | 319,929 | 85.3% |
[ 1.5% - 2.0% ] 1.58% | 197,755 | 87.7% |
[ 1.5% - 2.0% ] 1.68% | 221,623 | 81.3% |
[ 1.5% - 2.0% ] 1.82% | 362,744 | 83.6% |
[ 1.5% - 2.0% ] 1.91% | 104,757 | 76.0% |
[ 2.0% - 2.5% ] 2.05% | 343,717 | 74.5% |
[ 2.0% - 2.5% ] 2.20% | 215,673 | 78.1% |
[ 2.0% - 2.5% ] 2.29% | 26,676 | 78.4% |
[ 2.0% - 2.5% ] 2.41% | 120,839 | 82.4% |
[ 2.5% - 3.0% ] 2.53% | 163,270 | 77.9% |
[ 2.5% - 3.0% ] 2.72% | 31,505 | 88.9% |
[ 2.5% - 3.0% ] 2.80% | 184,081 | 85.3% |
[ 2.5% - 3.0% ] 2.92% | 103,810 | 85.4% |
[ 3.0% - 3.5% ] 3.07% | 83,553 | 71.6% |
[ 3.0% - 3.5% ] 3.23% | 13,404 | 62.7% |
[ 3.0% - 3.5% ] 3.31% | 77,829 | 88.7% |
[ 3.0% - 3.5% ] 3.46% | 37,993 | 84.3% |
[ 3.5% - 4.0% ] 3.54% | 90,831 | 82.8% |
[ 3.5% - 4.0% ] 3.65% | 16,296 | 86.9% |
[ 3.5% - 4.0% ] 3.84% | 18,624 | 83.7% |
[ 3.5% - 4.0% ] 3.89% | 19,850 | 88.0% |
[ 4.0% - 4.5% ] 4.12% | 43,579 | 79.4% |
[ 4.0% - 4.5% ] 4.20% | 32,800 | 90.2% |
[ 4.0% - 4.5% ] 4.44% | 64,636 | 85.7% |
[ 4.5% - 5.0% ] 4.58% | 111,351 | 81.3% |
[ 4.5% - 5.0% ] 4.64% | 3,620 | 94.8% |
[ 4.5% - 5.0% ] 4.90% | 2,654 | 85.9% |
[ 5.0% - 5.5% ] 5.17% | 82,353 | 80.9% |
[ 5.5% - 6.0% ] 5.61% | 196 | 71.7% |
[ 5.5% - 6.0% ] 5.67% | 2,436 | 88.1% |
[ 6.0% - 6.5% ] 6.05% | 215 | 92.4% |
[ 6.0% - 6.5% ] 6.16% | 86,201 | 78.3% |
[ 6.0% - 6.5% ] 6.45% | 10,466 | 85.6% |
[ 6.5% - 7.0% ] 6.53% | 337 | 84.4% |
[ 6.5% - 7.0% ] 6.74% | 11,966 | 85.3% |
[ 6.5% - 7.0% ] 6.95% | 5,572 | 79.8% |
[ 7.0% - 7.5% ] 7.15% | 1,581 | 61.3% |
[ 7.0% - 7.5% ] 7.31% | 12,072 | 81.1% |
[ 7.5% - 8.0% ] 7.76% | 100,787 | 70.4% |
[ 7.5% - 8.0% ] 8.00% | 21,383 | 79.3% |
[ 8.0% - 8.5% ] 8.11% | 47,012 | 80.7% |
[ 8.0% - 8.5% ] 8.29% | 16,286 | 61.1% |
[ 8.5% - 9.0% ] 8.54% | 56,696 | 69.5% |
[ 8.5% - 9.0% ] 8.68% | 27,162 | 83.2% |
[ 8.5% - 9.0% ] 8.86% | 27,548 | 85.8% |
[ 9.0% - 9.5% ] 9.09% | 132 | 88.3% |
[ 9.0% - 9.5% ] 9.22% | 25,084 | 75.3% |
[ 9.5% - 10.0% ] 9.53% | 18,445 | 68.3% |
[ 9.5% - 10.0% ] 9.96% | 562 | 61.7% |
[ 10.5% - 11.0% ] 10.61% | 12,465 | 66.5% |
[ 10.5% - 11.0% ] 11.00% | 30,558 | 73.7% |
[ 11.0% - 11.5% ] 11.03% | 263 | 81.5% |
[ 11.0% - 11.5% ] 11.21% | 93,781 | 69.4% |
[ 11.5% - 12.0% ] 11.71% | 8,763 | 68.7% |
[ 11.5% - 12.0% ] 11.82% | 17,164 | 67.2% |
[ 12.0% - 12.5% ] 12.36% | 26,807 | 66.3% |
[ 13.0% - 13.5% ] 13.22% | 21,742 | 75.3% |
[ 13.5% - 14.0% ] 13.68% | 6,484 | 74.9% |
[ 13.5% - 14.0% ] 13.85% | 130 | 100.0% |
[ 14.0% - 14.5% ] 14.05% | 121 | 70.2% |
[ 16.5% - 17.0% ] 16.67% | 108 | 100.0% |
[ 16.5% - 17.0% ] 16.93% | 4,660 | 79.8% |
[ 25.0% - 25.5% ] 25.00% | 60 | 75.0% |