Immigrants from Portugal Disability Age Under 5
COMPARE
Immigrants from Portugal
Select to Compare
Disability Age Under 5
Immigrants from Portugal Disability Age Under 5
1.8%
DISABILITY | AGE UNDER 5
0.0/ 100
METRIC RATING
325th/ 347
METRIC RANK
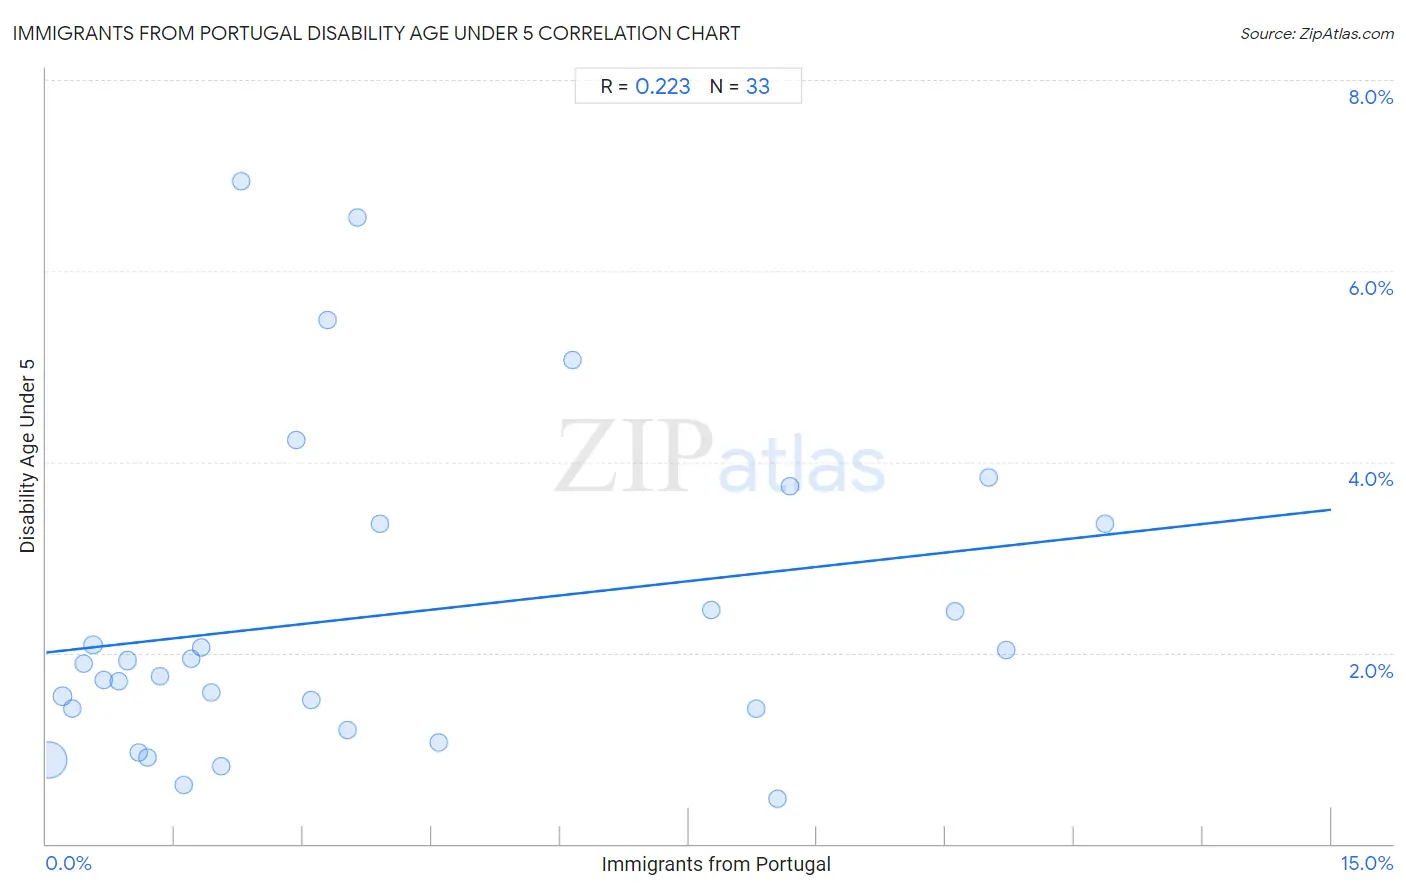
Immigrants from Portugal Disability Age Under 5 Correlation Chart
The statistical analysis conducted on geographies consisting of 112,092,431 people shows a weak positive correlation between the proportion of Immigrants from Portugal and percentage of population with a disability under the age of 5 in the United States with a correlation coefficient (R) of 0.223 and weighted average of 1.8%. On average, for every 1% (one percent) increase in Immigrants from Portugal within a typical geography, there is an increase of 0.100% in percentage of population with a disability under the age of 5.
It is essential to understand that the correlation between the percentage of Immigrants from Portugal and percentage of population with a disability under the age of 5 does not imply a direct cause-and-effect relationship. It remains uncertain whether the presence of Immigrants from Portugal influences an upward or downward trend in the level of percentage of population with a disability under the age of 5 within an area, or if Immigrants from Portugal simply ended up residing in those areas with higher or lower levels of percentage of population with a disability under the age of 5 due to other factors.
Demographics Similar to Immigrants from Portugal by Disability Age Under 5
In terms of disability age under 5, the demographic groups most similar to Immigrants from Portugal are Cherokee (1.8%, a difference of 1.3%), Sioux (1.8%, a difference of 1.4%), Osage (1.8%, a difference of 1.8%), Chickasaw (1.7%, a difference of 3.1%), and American (1.9%, a difference of 3.5%).
| Demographics | Rating | Rank | Disability Age Under 5 |
| Irish | 0.0 /100 | #318 | Tragic 1.7% |
| Slovaks | 0.0 /100 | #319 | Tragic 1.7% |
| Scotch-Irish | 0.0 /100 | #320 | Tragic 1.7% |
| Ottawa | 0.0 /100 | #321 | Tragic 1.7% |
| Germans | 0.0 /100 | #322 | Tragic 1.7% |
| Chickasaw | 0.0 /100 | #323 | Tragic 1.7% |
| Cherokee | 0.0 /100 | #324 | Tragic 1.8% |
| Immigrants from Portugal | 0.0 /100 | #325 | Tragic 1.8% |
| Sioux | 0.0 /100 | #326 | Tragic 1.8% |
| Osage | 0.0 /100 | #327 | Tragic 1.8% |
| Americans | 0.0 /100 | #328 | Tragic 1.9% |
| Houma | 0.0 /100 | #329 | Tragic 1.9% |
| Choctaw | 0.0 /100 | #330 | Tragic 1.9% |
| French Canadians | 0.0 /100 | #331 | Tragic 1.9% |
| Chippewa | 0.0 /100 | #332 | Tragic 1.9% |
Immigrants from Portugal Disability Age Under 5 Correlation Summary
| Measurement | Immigrants from Portugal Data | Disability Age Under 5 Data |
| Minimum | 0.028% | 0.48% |
| Maximum | 12.4% | 6.9% |
| Range | 12.3% | 6.5% |
| Mean | 3.9% | 2.4% |
| Median | 2.3% | 1.9% |
| Interquartile 25% (IQ1) | 1.0% | 1.3% |
| Interquartile 75% (IQ3) | 6.9% | 3.4% |
| Interquartile Range (IQR) | 5.9% | 2.1% |
| Standard Deviation (Sample) | 3.7% | 1.7% |
| Standard Deviation (Population) | 3.7% | 1.6% |
Correlation Details
| Immigrants from Portugal Percentile | Sample Size | Disability Age Under 5 |
[ 0.0% - 0.5% ] 0.028% | 98,449,537 | 0.88% |
[ 0.0% - 0.5% ] 0.19% | 6,872,972 | 1.5% |
[ 0.0% - 0.5% ] 0.30% | 1,903,605 | 1.4% |
[ 0.0% - 0.5% ] 0.43% | 1,081,968 | 1.9% |
[ 0.5% - 1.0% ] 0.55% | 962,843 | 2.1% |
[ 0.5% - 1.0% ] 0.66% | 349,498 | 1.7% |
[ 0.5% - 1.0% ] 0.85% | 34,621 | 1.7% |
[ 0.5% - 1.0% ] 0.94% | 457,391 | 1.9% |
[ 1.0% - 1.5% ] 1.08% | 176,984 | 0.96% |
[ 1.0% - 1.5% ] 1.18% | 64,023 | 0.90% |
[ 1.0% - 1.5% ] 1.32% | 256,648 | 1.8% |
[ 1.5% - 2.0% ] 1.61% | 108,155 | 0.62% |
[ 1.5% - 2.0% ] 1.69% | 117,145 | 1.9% |
[ 1.5% - 2.0% ] 1.81% | 176,063 | 2.1% |
[ 1.5% - 2.0% ] 1.93% | 54,125 | 1.6% |
[ 2.0% - 2.5% ] 2.04% | 307,355 | 0.82% |
[ 2.0% - 2.5% ] 2.28% | 10,264 | 6.9% |
[ 2.5% - 3.0% ] 2.92% | 56,900 | 4.2% |
[ 3.0% - 3.5% ] 3.10% | 25,674 | 1.5% |
[ 3.0% - 3.5% ] 3.28% | 19,947 | 5.5% |
[ 3.5% - 4.0% ] 3.51% | 36,546 | 1.2% |
[ 3.5% - 4.0% ] 3.64% | 15,496 | 6.6% |
[ 3.5% - 4.0% ] 3.89% | 16,324 | 3.3% |
[ 4.5% - 5.0% ] 4.58% | 111,351 | 1.1% |
[ 6.0% - 6.5% ] 6.14% | 69,043 | 5.1% |
[ 7.5% - 8.0% ] 7.76% | 100,620 | 2.4% |
[ 8.0% - 8.5% ] 8.29% | 16,286 | 1.4% |
[ 8.5% - 9.0% ] 8.54% | 56,696 | 0.48% |
[ 8.5% - 9.0% ] 8.68% | 20,883 | 3.7% |
[ 10.5% - 11.0% ] 10.61% | 12,465 | 2.4% |
[ 10.5% - 11.0% ] 11.00% | 30,558 | 3.8% |
[ 11.0% - 11.5% ] 11.21% | 93,638 | 2.0% |
[ 12.0% - 12.5% ] 12.36% | 26,807 | 3.4% |