Immigrants from Portugal 4 or more Vehicles in Household
COMPARE
Immigrants from Portugal
Select to Compare
4 or more Vehicles in Household
Immigrants from Portugal 4 or more Vehicles in Household
6.1%
4+ VEHICLES AVAILABLE
22.3/ 100
METRIC RATING
198th/ 347
METRIC RANK
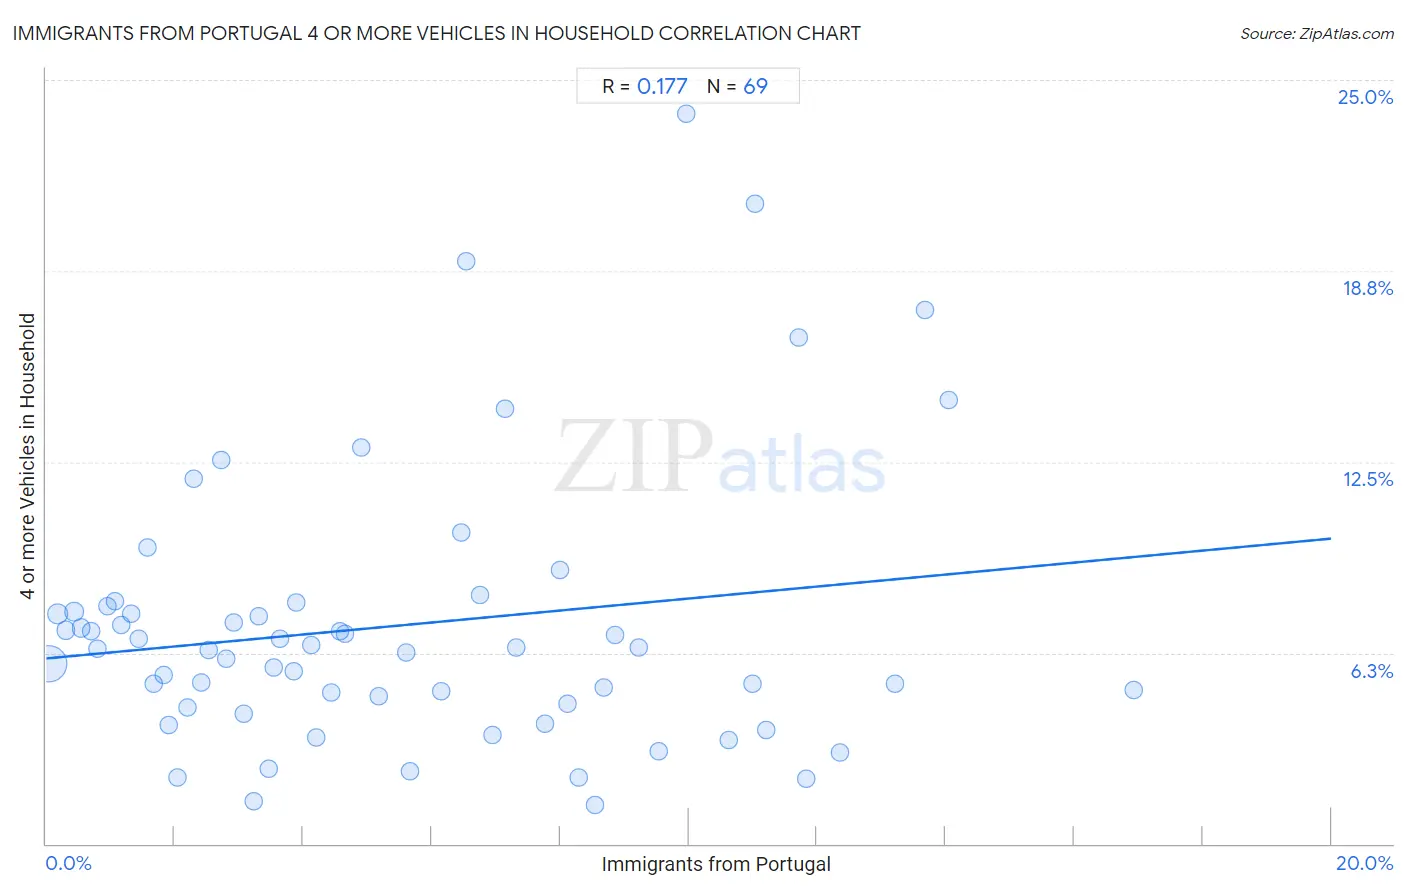
Immigrants from Portugal 4 or more Vehicles in Household Correlation Chart
The statistical analysis conducted on geographies consisting of 173,887,312 people shows a poor positive correlation between the proportion of Immigrants from Portugal and percentage of households with 4 or more vehicles available in the United States with a correlation coefficient (R) of 0.177 and weighted average of 6.1%. On average, for every 1% (one percent) increase in Immigrants from Portugal within a typical geography, there is an increase of 0.20% in percentage of households with 4 or more vehicles available.
It is essential to understand that the correlation between the percentage of Immigrants from Portugal and percentage of households with 4 or more vehicles available does not imply a direct cause-and-effect relationship. It remains uncertain whether the presence of Immigrants from Portugal influences an upward or downward trend in the level of percentage of households with 4 or more vehicles available within an area, or if Immigrants from Portugal simply ended up residing in those areas with higher or lower levels of percentage of households with 4 or more vehicles available due to other factors.
Demographics Similar to Immigrants from Portugal by 4 or more Vehicles in Household
In terms of 4 or more vehicles in household, the demographic groups most similar to Immigrants from Portugal are Immigrants from Norway (6.1%, a difference of 0.080%), Latvian (6.1%, a difference of 0.090%), Egyptian (6.1%, a difference of 0.14%), Immigrants from South Central Asia (6.1%, a difference of 0.15%), and Immigrants from Sri Lanka (6.1%, a difference of 0.20%).
| Demographics | Rating | Rank | 4 or more Vehicles in Household |
| Inupiat | 30.7 /100 | #191 | Fair 6.2% |
| Romanians | 30.7 /100 | #192 | Fair 6.2% |
| Immigrants from Kuwait | 28.0 /100 | #193 | Fair 6.2% |
| Immigrants from Sweden | 27.0 /100 | #194 | Fair 6.2% |
| Argentineans | 27.0 /100 | #195 | Fair 6.2% |
| Tsimshian | 26.4 /100 | #196 | Fair 6.2% |
| Immigrants from Sri Lanka | 23.7 /100 | #197 | Fair 6.1% |
| Immigrants from Portugal | 22.3 /100 | #198 | Fair 6.1% |
| Immigrants from Norway | 21.8 /100 | #199 | Fair 6.1% |
| Latvians | 21.7 /100 | #200 | Fair 6.1% |
| Egyptians | 21.4 /100 | #201 | Fair 6.1% |
| Immigrants from South Central Asia | 21.3 /100 | #202 | Fair 6.1% |
| Immigrants from Sierra Leone | 20.5 /100 | #203 | Fair 6.1% |
| Immigrants from Belize | 19.8 /100 | #204 | Poor 6.1% |
| Hondurans | 19.3 /100 | #205 | Poor 6.1% |
Immigrants from Portugal 4 or more Vehicles in Household Correlation Summary
| Measurement | Immigrants from Portugal Data | 4 or more Vehicles in Household Data |
| Minimum | 0.034% | 1.3% |
| Maximum | 16.9% | 23.9% |
| Range | 16.9% | 22.6% |
| Mean | 5.5% | 7.1% |
| Median | 4.4% | 6.4% |
| Interquartile 25% (IQ1) | 2.1% | 4.5% |
| Interquartile 75% (IQ3) | 8.4% | 7.7% |
| Interquartile Range (IQR) | 6.3% | 3.2% |
| Standard Deviation (Sample) | 4.1% | 4.5% |
| Standard Deviation (Population) | 4.1% | 4.5% |
Correlation Details
| Immigrants from Portugal Percentile | Sample Size | 4 or more Vehicles in Household |
[ 0.0% - 0.5% ] 0.034% | 138,400,789 | 5.9% |
[ 0.0% - 0.5% ] 0.18% | 16,610,794 | 7.5% |
[ 0.0% - 0.5% ] 0.30% | 5,389,723 | 7.0% |
[ 0.0% - 0.5% ] 0.43% | 3,114,638 | 7.6% |
[ 0.5% - 1.0% ] 0.55% | 2,527,216 | 7.1% |
[ 0.5% - 1.0% ] 0.69% | 1,310,268 | 7.0% |
[ 0.5% - 1.0% ] 0.80% | 636,355 | 6.4% |
[ 0.5% - 1.0% ] 0.95% | 666,663 | 7.8% |
[ 1.0% - 1.5% ] 1.06% | 688,136 | 7.9% |
[ 1.0% - 1.5% ] 1.17% | 308,907 | 7.2% |
[ 1.0% - 1.5% ] 1.33% | 475,930 | 7.5% |
[ 1.0% - 1.5% ] 1.45% | 307,541 | 6.7% |
[ 1.5% - 2.0% ] 1.58% | 195,706 | 9.7% |
[ 1.5% - 2.0% ] 1.68% | 204,160 | 5.2% |
[ 1.5% - 2.0% ] 1.82% | 362,744 | 5.5% |
[ 1.5% - 2.0% ] 1.91% | 104,757 | 3.9% |
[ 2.0% - 2.5% ] 2.05% | 343,717 | 2.2% |
[ 2.0% - 2.5% ] 2.20% | 215,673 | 4.4% |
[ 2.0% - 2.5% ] 2.29% | 26,676 | 12.0% |
[ 2.0% - 2.5% ] 2.41% | 120,839 | 5.3% |
[ 2.5% - 3.0% ] 2.53% | 163,270 | 6.3% |
[ 2.5% - 3.0% ] 2.72% | 31,505 | 12.6% |
[ 2.5% - 3.0% ] 2.80% | 184,081 | 6.1% |
[ 2.5% - 3.0% ] 2.92% | 103,810 | 7.2% |
[ 3.0% - 3.5% ] 3.07% | 83,553 | 4.3% |
[ 3.0% - 3.5% ] 3.23% | 13,154 | 1.4% |
[ 3.0% - 3.5% ] 3.31% | 77,829 | 7.4% |
[ 3.0% - 3.5% ] 3.46% | 37,993 | 2.5% |
[ 3.5% - 4.0% ] 3.54% | 90,831 | 5.8% |
[ 3.5% - 4.0% ] 3.65% | 16,296 | 6.7% |
[ 3.5% - 4.0% ] 3.84% | 18,624 | 5.6% |
[ 3.5% - 4.0% ] 3.89% | 19,747 | 7.9% |
[ 4.0% - 4.5% ] 4.12% | 43,579 | 6.5% |
[ 4.0% - 4.5% ] 4.20% | 32,800 | 3.5% |
[ 4.0% - 4.5% ] 4.44% | 64,636 | 5.0% |
[ 4.5% - 5.0% ] 4.58% | 111,351 | 7.0% |
[ 4.5% - 5.0% ] 4.64% | 3,620 | 6.9% |
[ 4.5% - 5.0% ] 4.90% | 2,654 | 13.0% |
[ 5.0% - 5.5% ] 5.17% | 82,314 | 4.8% |
[ 5.5% - 6.0% ] 5.61% | 196 | 6.2% |
[ 5.5% - 6.0% ] 5.67% | 2,436 | 2.4% |
[ 6.0% - 6.5% ] 6.16% | 86,201 | 5.0% |
[ 6.0% - 6.5% ] 6.45% | 10,466 | 10.2% |
[ 6.5% - 7.0% ] 6.53% | 337 | 19.1% |
[ 6.5% - 7.0% ] 6.74% | 11,966 | 8.1% |
[ 6.5% - 7.0% ] 6.95% | 5,572 | 3.6% |
[ 7.0% - 7.5% ] 7.15% | 1,581 | 14.2% |
[ 7.0% - 7.5% ] 7.31% | 12,072 | 6.4% |
[ 7.5% - 8.0% ] 7.76% | 100,620 | 3.9% |
[ 7.5% - 8.0% ] 8.00% | 21,383 | 8.9% |
[ 8.0% - 8.5% ] 8.11% | 47,012 | 4.6% |
[ 8.0% - 8.5% ] 8.29% | 16,286 | 2.2% |
[ 8.5% - 9.0% ] 8.54% | 56,696 | 1.3% |
[ 8.5% - 9.0% ] 8.68% | 27,162 | 5.1% |
[ 8.5% - 9.0% ] 8.86% | 27,548 | 6.8% |
[ 9.0% - 9.5% ] 9.22% | 25,084 | 6.4% |
[ 9.5% - 10.0% ] 9.53% | 18,445 | 3.0% |
[ 9.5% - 10.0% ] 9.96% | 562 | 23.9% |
[ 10.5% - 11.0% ] 10.61% | 12,465 | 3.4% |
[ 10.5% - 11.0% ] 11.00% | 30,558 | 5.2% |
[ 11.0% - 11.5% ] 11.03% | 263 | 21.0% |
[ 11.0% - 11.5% ] 11.21% | 93,781 | 3.7% |
[ 11.5% - 12.0% ] 11.71% | 8,763 | 16.6% |
[ 11.5% - 12.0% ] 11.82% | 17,164 | 2.1% |
[ 12.0% - 12.5% ] 12.36% | 26,807 | 3.0% |
[ 13.0% - 13.5% ] 13.22% | 21,742 | 5.2% |
[ 13.5% - 14.0% ] 13.68% | 6,484 | 17.5% |
[ 14.0% - 14.5% ] 14.05% | 121 | 14.5% |
[ 16.5% - 17.0% ] 16.93% | 4,660 | 5.0% |