Immigrants from Pakistan 4 or more Vehicles in Household
COMPARE
Immigrants from Pakistan
Select to Compare
4 or more Vehicles in Household
Immigrants from Pakistan 4 or more Vehicles in Household
6.4%
4+ VEHICLES AVAILABLE
63.2/ 100
METRIC RATING
162nd/ 347
METRIC RANK
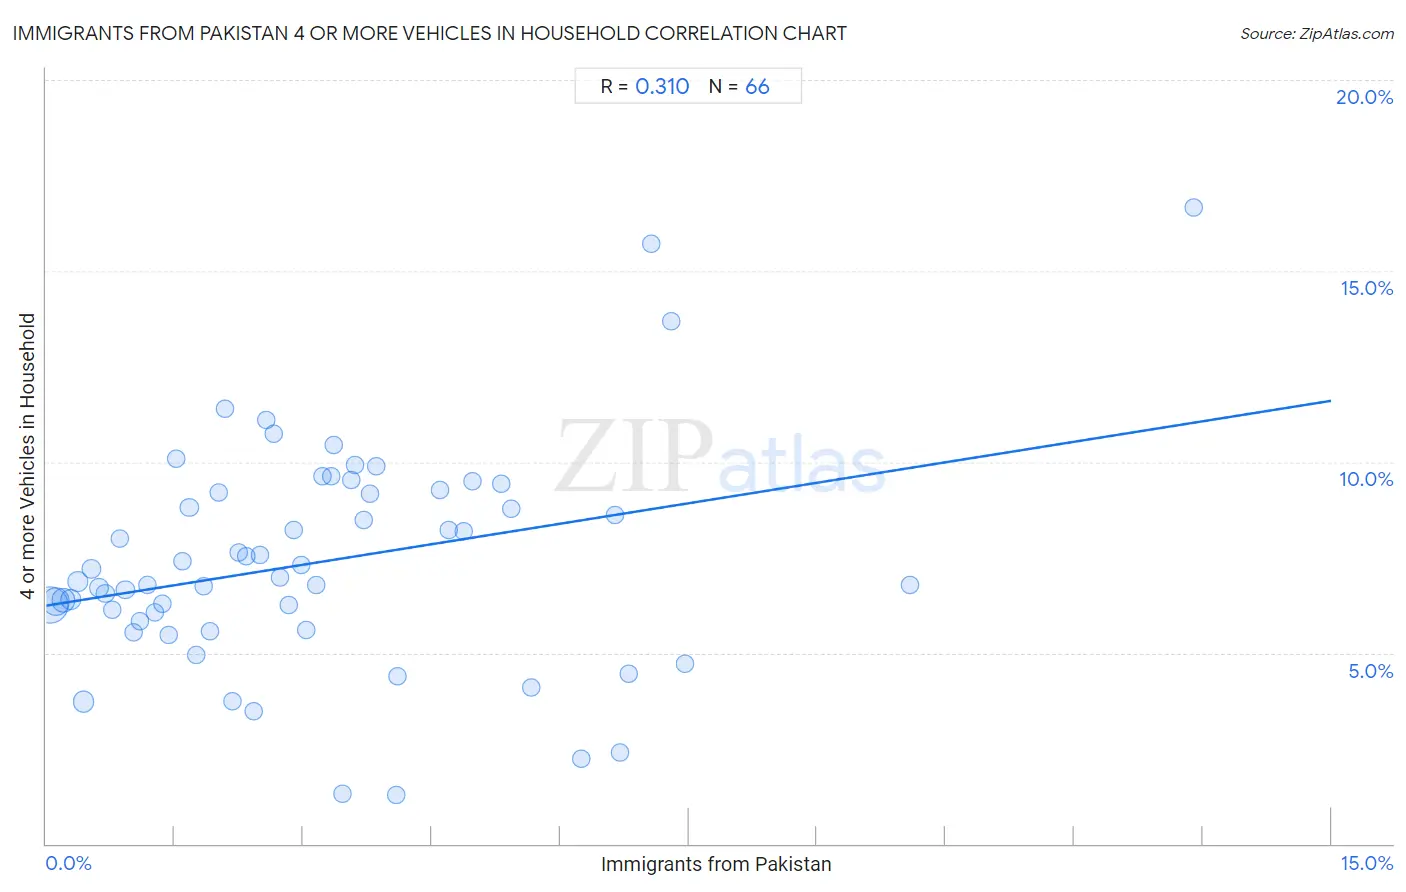
Immigrants from Pakistan 4 or more Vehicles in Household Correlation Chart
The statistical analysis conducted on geographies consisting of 282,597,587 people shows a mild positive correlation between the proportion of Immigrants from Pakistan and percentage of households with 4 or more vehicles available in the United States with a correlation coefficient (R) of 0.310 and weighted average of 6.4%. On average, for every 1% (one percent) increase in Immigrants from Pakistan within a typical geography, there is an increase of 0.36% in percentage of households with 4 or more vehicles available.
It is essential to understand that the correlation between the percentage of Immigrants from Pakistan and percentage of households with 4 or more vehicles available does not imply a direct cause-and-effect relationship. It remains uncertain whether the presence of Immigrants from Pakistan influences an upward or downward trend in the level of percentage of households with 4 or more vehicles available within an area, or if Immigrants from Pakistan simply ended up residing in those areas with higher or lower levels of percentage of households with 4 or more vehicles available due to other factors.
Demographics Similar to Immigrants from Pakistan by 4 or more Vehicles in Household
In terms of 4 or more vehicles in household, the demographic groups most similar to Immigrants from Pakistan are Immigrants from Cameroon (6.4%, a difference of 0.13%), Chilean (6.4%, a difference of 0.22%), Hungarian (6.4%, a difference of 0.22%), Palestinian (6.4%, a difference of 0.28%), and Indian (Asian) (6.4%, a difference of 0.33%).
| Demographics | Rating | Rank | 4 or more Vehicles in Household |
| Iroquois | 70.4 /100 | #155 | Good 6.5% |
| Iranians | 69.9 /100 | #156 | Good 6.5% |
| Peruvians | 69.4 /100 | #157 | Good 6.5% |
| Zimbabweans | 67.1 /100 | #158 | Good 6.4% |
| Indians (Asian) | 66.3 /100 | #159 | Good 6.4% |
| Palestinians | 65.8 /100 | #160 | Good 6.4% |
| Immigrants from Cameroon | 64.4 /100 | #161 | Good 6.4% |
| Immigrants from Pakistan | 63.2 /100 | #162 | Good 6.4% |
| Chileans | 61.2 /100 | #163 | Good 6.4% |
| Hungarians | 61.1 /100 | #164 | Good 6.4% |
| Immigrants from Peru | 59.8 /100 | #165 | Average 6.4% |
| Immigrants from Denmark | 57.8 /100 | #166 | Average 6.4% |
| Poles | 56.9 /100 | #167 | Average 6.4% |
| Lebanese | 55.8 /100 | #168 | Average 6.4% |
| Estonians | 55.1 /100 | #169 | Average 6.4% |
Immigrants from Pakistan 4 or more Vehicles in Household Correlation Summary
| Measurement | Immigrants from Pakistan Data | 4 or more Vehicles in Household Data |
| Minimum | 0.041% | 1.3% |
| Maximum | 13.4% | 16.7% |
| Range | 13.4% | 15.4% |
| Mean | 3.2% | 7.4% |
| Median | 2.7% | 6.9% |
| Interquartile 25% (IQ1) | 1.4% | 5.8% |
| Interquartile 75% (IQ3) | 4.1% | 9.2% |
| Interquartile Range (IQR) | 2.7% | 3.4% |
| Standard Deviation (Sample) | 2.5% | 2.9% |
| Standard Deviation (Population) | 2.5% | 2.9% |
Correlation Details
| Immigrants from Pakistan Percentile | Sample Size | 4 or more Vehicles in Household |
[ 0.0% - 0.5% ] 0.041% | 111,501,771 | 6.2% |
[ 0.0% - 0.5% ] 0.12% | 55,695,747 | 6.3% |
[ 0.0% - 0.5% ] 0.20% | 33,765,668 | 6.4% |
[ 0.0% - 0.5% ] 0.29% | 19,784,256 | 6.4% |
[ 0.0% - 0.5% ] 0.37% | 11,365,201 | 6.9% |
[ 0.0% - 0.5% ] 0.44% | 17,168,835 | 3.7% |
[ 0.5% - 1.0% ] 0.53% | 5,810,019 | 7.2% |
[ 0.5% - 1.0% ] 0.61% | 4,239,586 | 6.7% |
[ 0.5% - 1.0% ] 0.69% | 3,403,600 | 6.6% |
[ 0.5% - 1.0% ] 0.77% | 2,834,148 | 6.1% |
[ 0.5% - 1.0% ] 0.86% | 2,118,060 | 8.0% |
[ 0.5% - 1.0% ] 0.92% | 2,990,450 | 6.6% |
[ 1.0% - 1.5% ] 1.02% | 1,733,786 | 5.5% |
[ 1.0% - 1.5% ] 1.10% | 831,049 | 5.8% |
[ 1.0% - 1.5% ] 1.19% | 983,043 | 6.8% |
[ 1.0% - 1.5% ] 1.26% | 1,330,454 | 6.1% |
[ 1.0% - 1.5% ] 1.35% | 676,332 | 6.3% |
[ 1.0% - 1.5% ] 1.43% | 517,882 | 5.5% |
[ 1.5% - 2.0% ] 1.51% | 657,050 | 10.1% |
[ 1.5% - 2.0% ] 1.59% | 473,446 | 7.4% |
[ 1.5% - 2.0% ] 1.67% | 505,976 | 8.8% |
[ 1.5% - 2.0% ] 1.76% | 242,728 | 4.9% |
[ 1.5% - 2.0% ] 1.83% | 410,995 | 6.7% |
[ 1.5% - 2.0% ] 1.91% | 195,966 | 5.6% |
[ 2.0% - 2.5% ] 2.01% | 123,228 | 9.2% |
[ 2.0% - 2.5% ] 2.09% | 157,869 | 11.4% |
[ 2.0% - 2.5% ] 2.17% | 386,225 | 3.7% |
[ 2.0% - 2.5% ] 2.24% | 363,055 | 7.6% |
[ 2.0% - 2.5% ] 2.33% | 135,957 | 7.5% |
[ 2.0% - 2.5% ] 2.42% | 203,564 | 3.5% |
[ 2.0% - 2.5% ] 2.50% | 254,522 | 7.6% |
[ 2.5% - 3.0% ] 2.57% | 73,701 | 11.1% |
[ 2.5% - 3.0% ] 2.66% | 76,966 | 10.7% |
[ 2.5% - 3.0% ] 2.72% | 99,561 | 7.0% |
[ 2.5% - 3.0% ] 2.83% | 99,677 | 6.3% |
[ 2.5% - 3.0% ] 2.89% | 178,062 | 8.2% |
[ 2.5% - 3.0% ] 2.97% | 38,862 | 7.3% |
[ 3.0% - 3.5% ] 3.04% | 129,420 | 5.6% |
[ 3.0% - 3.5% ] 3.16% | 67,044 | 6.8% |
[ 3.0% - 3.5% ] 3.23% | 32,104 | 9.6% |
[ 3.0% - 3.5% ] 3.32% | 36,559 | 9.6% |
[ 3.0% - 3.5% ] 3.36% | 134,107 | 10.4% |
[ 3.0% - 3.5% ] 3.46% | 109,978 | 1.3% |
[ 3.5% - 4.0% ] 3.56% | 18,357 | 9.5% |
[ 3.5% - 4.0% ] 3.61% | 63,183 | 9.9% |
[ 3.5% - 4.0% ] 3.70% | 86,647 | 8.5% |
[ 3.5% - 4.0% ] 3.78% | 123,078 | 9.2% |
[ 3.5% - 4.0% ] 3.85% | 9,567 | 9.9% |
[ 4.0% - 4.5% ] 4.08% | 4,265 | 1.3% |
[ 4.0% - 4.5% ] 4.10% | 31,609 | 4.4% |
[ 4.5% - 5.0% ] 4.60% | 50,245 | 9.3% |
[ 4.5% - 5.0% ] 4.70% | 12,209 | 8.2% |
[ 4.5% - 5.0% ] 4.88% | 17,793 | 8.2% |
[ 4.5% - 5.0% ] 4.97% | 95,920 | 9.5% |
[ 5.0% - 5.5% ] 5.32% | 30,553 | 9.4% |
[ 5.0% - 5.5% ] 5.43% | 13,010 | 8.8% |
[ 5.5% - 6.0% ] 5.66% | 10,566 | 4.1% |
[ 6.0% - 6.5% ] 6.24% | 945 | 2.2% |
[ 6.5% - 7.0% ] 6.64% | 76,600 | 8.6% |
[ 6.5% - 7.0% ] 6.70% | 1,374 | 2.4% |
[ 6.5% - 7.0% ] 6.80% | 3,296 | 4.4% |
[ 7.0% - 7.5% ] 7.07% | 2,533 | 15.7% |
[ 7.0% - 7.5% ] 7.29% | 329 | 13.7% |
[ 7.0% - 7.5% ] 7.46% | 3,002 | 4.7% |
[ 10.0% - 10.5% ] 10.08% | 5,803 | 6.8% |
[ 13.0% - 13.5% ] 13.40% | 194 | 16.7% |