Immigrants from Pakistan Self-Care Disability
COMPARE
Immigrants from Pakistan
Select to Compare
Self-Care Disability
Immigrants from Pakistan Self-Care Disability
2.3%
SELF-CARE DISABILITY
99.8/ 100
METRIC RATING
43rd/ 347
METRIC RANK
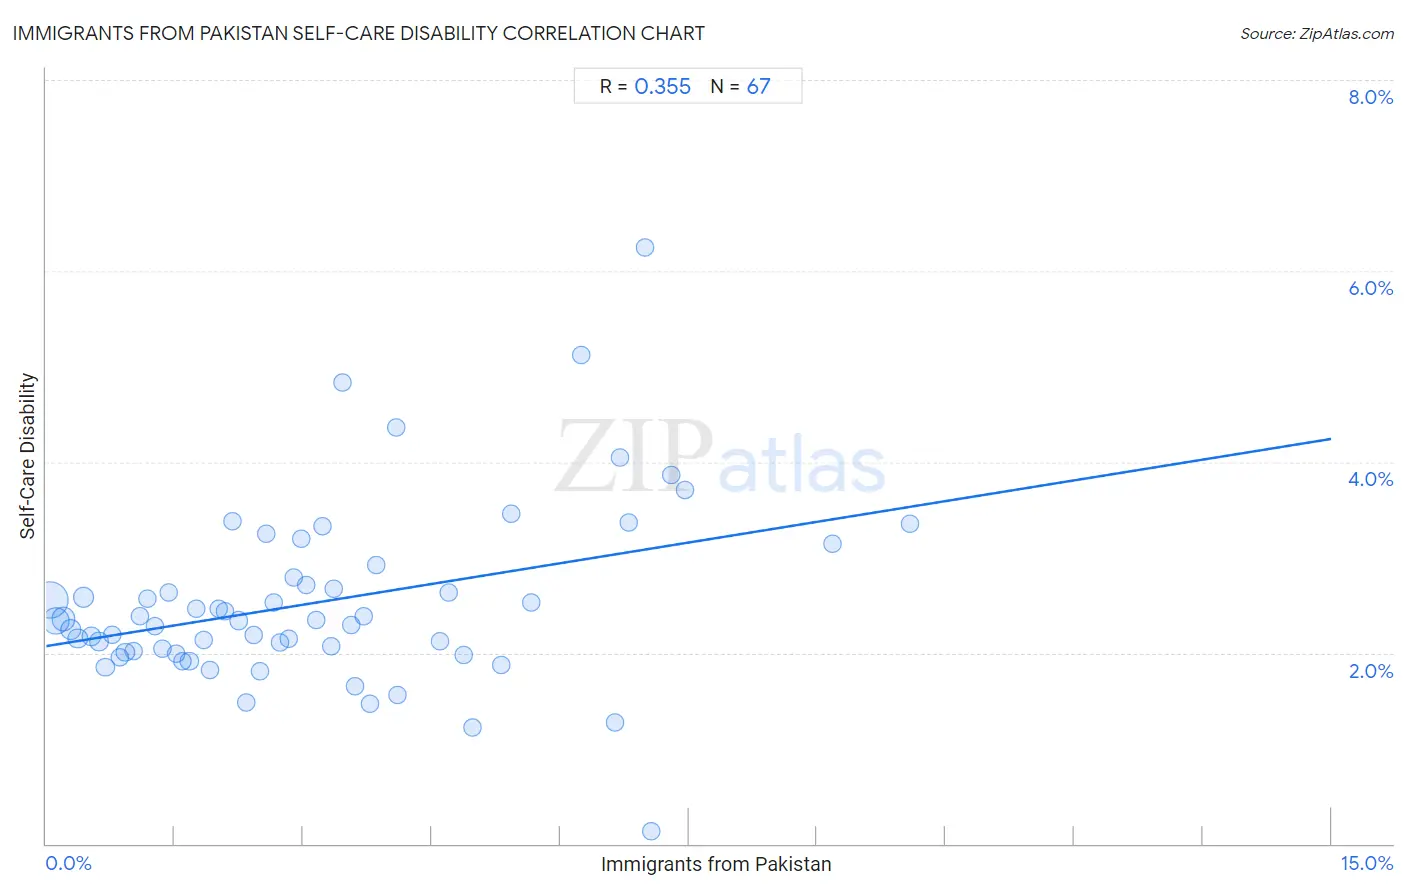
Immigrants from Pakistan Self-Care Disability Correlation Chart
The statistical analysis conducted on geographies consisting of 283,675,484 people shows a mild positive correlation between the proportion of Immigrants from Pakistan and percentage of population with self-care disability in the United States with a correlation coefficient (R) of 0.355 and weighted average of 2.3%. On average, for every 1% (one percent) increase in Immigrants from Pakistan within a typical geography, there is an increase of 0.14% in percentage of population with self-care disability.
It is essential to understand that the correlation between the percentage of Immigrants from Pakistan and percentage of population with self-care disability does not imply a direct cause-and-effect relationship. It remains uncertain whether the presence of Immigrants from Pakistan influences an upward or downward trend in the level of percentage of population with self-care disability within an area, or if Immigrants from Pakistan simply ended up residing in those areas with higher or lower levels of percentage of population with self-care disability due to other factors.
Demographics Similar to Immigrants from Pakistan by Self-Care Disability
In terms of self-care disability, the demographic groups most similar to Immigrants from Pakistan are Immigrants from South Africa (2.3%, a difference of 0.040%), Immigrants from Uganda (2.3%, a difference of 0.050%), Norwegian (2.3%, a difference of 0.090%), Immigrants from Sudan (2.3%, a difference of 0.14%), and Czech (2.3%, a difference of 0.17%).
| Demographics | Rating | Rank | Self-Care Disability |
| Immigrants from Lithuania | 99.9 /100 | #36 | Exceptional 2.3% |
| Immigrants from Sweden | 99.9 /100 | #37 | Exceptional 2.3% |
| Immigrants from Eastern Africa | 99.9 /100 | #38 | Exceptional 2.3% |
| Immigrants from Bulgaria | 99.8 /100 | #39 | Exceptional 2.3% |
| Iranians | 99.8 /100 | #40 | Exceptional 2.3% |
| Immigrants from Sudan | 99.8 /100 | #41 | Exceptional 2.3% |
| Immigrants from Uganda | 99.8 /100 | #42 | Exceptional 2.3% |
| Immigrants from Pakistan | 99.8 /100 | #43 | Exceptional 2.3% |
| Immigrants from South Africa | 99.8 /100 | #44 | Exceptional 2.3% |
| Norwegians | 99.8 /100 | #45 | Exceptional 2.3% |
| Czechs | 99.8 /100 | #46 | Exceptional 2.3% |
| Jordanians | 99.7 /100 | #47 | Exceptional 2.3% |
| Immigrants from Malaysia | 99.7 /100 | #48 | Exceptional 2.3% |
| Latvians | 99.7 /100 | #49 | Exceptional 2.3% |
| Immigrants from Brazil | 99.7 /100 | #50 | Exceptional 2.3% |
Immigrants from Pakistan Self-Care Disability Correlation Summary
| Measurement | Immigrants from Pakistan Data | Self-Care Disability Data |
| Minimum | 0.041% | 0.14% |
| Maximum | 10.1% | 6.2% |
| Range | 10.0% | 6.1% |
| Mean | 3.2% | 2.5% |
| Median | 2.7% | 2.3% |
| Interquartile 25% (IQ1) | 1.4% | 2.0% |
| Interquartile 75% (IQ3) | 4.6% | 2.8% |
| Interquartile Range (IQR) | 3.2% | 0.78% |
| Standard Deviation (Sample) | 2.3% | 0.95% |
| Standard Deviation (Population) | 2.3% | 0.94% |
Correlation Details
| Immigrants from Pakistan Percentile | Sample Size | Self-Care Disability |
[ 0.0% - 0.5% ] 0.041% | 111,829,021 | 2.6% |
[ 0.0% - 0.5% ] 0.12% | 56,107,955 | 2.3% |
[ 0.0% - 0.5% ] 0.20% | 33,824,095 | 2.4% |
[ 0.0% - 0.5% ] 0.29% | 19,872,238 | 2.2% |
[ 0.0% - 0.5% ] 0.37% | 11,369,455 | 2.2% |
[ 0.0% - 0.5% ] 0.44% | 17,231,758 | 2.6% |
[ 0.5% - 1.0% ] 0.53% | 5,828,229 | 2.2% |
[ 0.5% - 1.0% ] 0.61% | 4,253,453 | 2.1% |
[ 0.5% - 1.0% ] 0.69% | 3,429,172 | 1.8% |
[ 0.5% - 1.0% ] 0.77% | 2,834,901 | 2.2% |
[ 0.5% - 1.0% ] 0.86% | 2,142,088 | 2.0% |
[ 0.5% - 1.0% ] 0.92% | 3,028,492 | 2.0% |
[ 1.0% - 1.5% ] 1.02% | 1,733,786 | 2.0% |
[ 1.0% - 1.5% ] 1.10% | 836,684 | 2.4% |
[ 1.0% - 1.5% ] 1.19% | 983,392 | 2.6% |
[ 1.0% - 1.5% ] 1.26% | 1,342,300 | 2.3% |
[ 1.0% - 1.5% ] 1.35% | 667,847 | 2.0% |
[ 1.0% - 1.5% ] 1.43% | 517,882 | 2.6% |
[ 1.5% - 2.0% ] 1.51% | 656,256 | 2.0% |
[ 1.5% - 2.0% ] 1.59% | 472,472 | 1.9% |
[ 1.5% - 2.0% ] 1.67% | 505,976 | 1.9% |
[ 1.5% - 2.0% ] 1.76% | 242,728 | 2.5% |
[ 1.5% - 2.0% ] 1.83% | 410,995 | 2.1% |
[ 1.5% - 2.0% ] 1.91% | 195,966 | 1.8% |
[ 2.0% - 2.5% ] 2.01% | 123,228 | 2.5% |
[ 2.0% - 2.5% ] 2.09% | 157,869 | 2.4% |
[ 2.0% - 2.5% ] 2.17% | 384,915 | 3.4% |
[ 2.0% - 2.5% ] 2.24% | 363,055 | 2.3% |
[ 2.0% - 2.5% ] 2.33% | 135,957 | 1.5% |
[ 2.0% - 2.5% ] 2.42% | 202,805 | 2.2% |
[ 2.0% - 2.5% ] 2.50% | 254,522 | 1.8% |
[ 2.5% - 3.0% ] 2.57% | 73,701 | 3.2% |
[ 2.5% - 3.0% ] 2.66% | 76,816 | 2.5% |
[ 2.5% - 3.0% ] 2.72% | 99,561 | 2.1% |
[ 2.5% - 3.0% ] 2.83% | 96,192 | 2.1% |
[ 2.5% - 3.0% ] 2.89% | 178,062 | 2.8% |
[ 2.5% - 3.0% ] 2.97% | 38,862 | 3.2% |
[ 3.0% - 3.5% ] 3.04% | 129,420 | 2.7% |
[ 3.0% - 3.5% ] 3.16% | 67,044 | 2.3% |
[ 3.0% - 3.5% ] 3.23% | 32,104 | 3.3% |
[ 3.0% - 3.5% ] 3.32% | 36,559 | 2.1% |
[ 3.0% - 3.5% ] 3.36% | 134,107 | 2.7% |
[ 3.0% - 3.5% ] 3.46% | 109,978 | 4.8% |
[ 3.5% - 4.0% ] 3.56% | 18,357 | 2.3% |
[ 3.5% - 4.0% ] 3.61% | 63,183 | 1.7% |
[ 3.5% - 4.0% ] 3.70% | 86,647 | 2.4% |
[ 3.5% - 4.0% ] 3.78% | 123,078 | 1.5% |
[ 3.5% - 4.0% ] 3.85% | 9,567 | 2.9% |
[ 4.0% - 4.5% ] 4.08% | 4,265 | 4.4% |
[ 4.0% - 4.5% ] 4.10% | 31,609 | 1.6% |
[ 4.5% - 5.0% ] 4.60% | 50,245 | 2.1% |
[ 4.5% - 5.0% ] 4.70% | 12,209 | 2.6% |
[ 4.5% - 5.0% ] 4.88% | 17,793 | 2.0% |
[ 4.5% - 5.0% ] 4.97% | 95,920 | 1.2% |
[ 5.0% - 5.5% ] 5.32% | 30,553 | 1.9% |
[ 5.0% - 5.5% ] 5.43% | 13,010 | 3.5% |
[ 5.5% - 6.0% ] 5.66% | 10,990 | 2.5% |
[ 6.0% - 6.5% ] 6.24% | 945 | 5.1% |
[ 6.5% - 7.0% ] 6.64% | 76,600 | 1.3% |
[ 6.5% - 7.0% ] 6.70% | 1,374 | 4.0% |
[ 6.5% - 7.0% ] 6.80% | 3,296 | 3.4% |
[ 6.5% - 7.0% ] 6.99% | 143 | 6.2% |
[ 7.0% - 7.5% ] 7.07% | 2,533 | 0.14% |
[ 7.0% - 7.5% ] 7.29% | 329 | 3.9% |
[ 7.0% - 7.5% ] 7.46% | 3,002 | 3.7% |
[ 9.0% - 9.5% ] 9.18% | 2,135 | 3.1% |
[ 10.0% - 10.5% ] 10.08% | 5,803 | 3.4% |