Immigrants from Pakistan GED/Equivalency
COMPARE
Immigrants from Pakistan
Select to Compare
GED/Equivalency
Immigrants from Pakistan GED/Equivalency
86.4%
GED/EQUIVALENCY
82.4/ 100
METRIC RATING
143rd/ 347
METRIC RANK
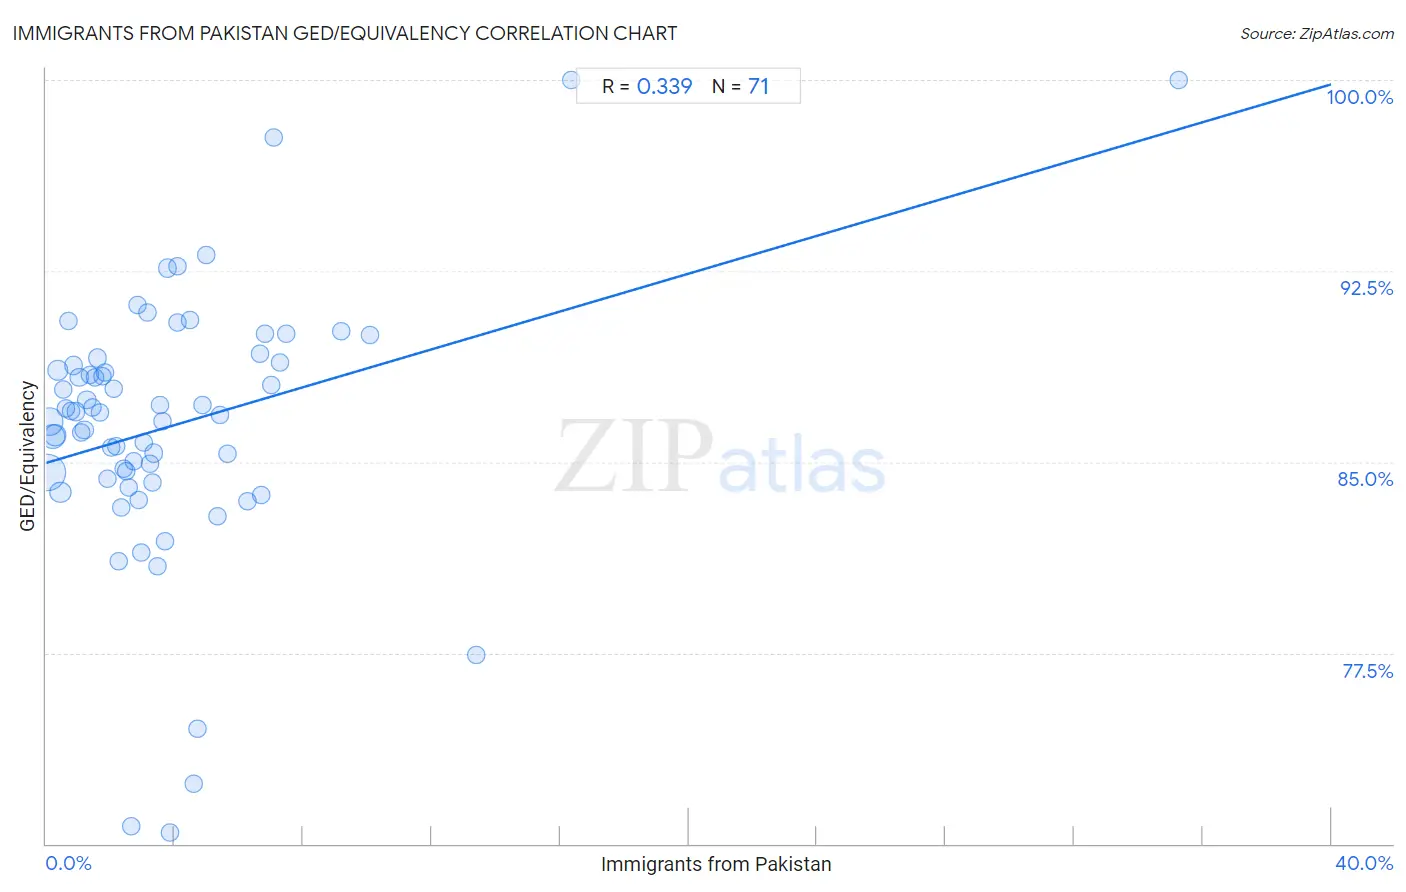
Immigrants from Pakistan GED/Equivalency Correlation Chart
The statistical analysis conducted on geographies consisting of 283,912,995 people shows a mild positive correlation between the proportion of Immigrants from Pakistan and percentage of population with at least ged/equivalency education in the United States with a correlation coefficient (R) of 0.339 and weighted average of 86.4%. On average, for every 1% (one percent) increase in Immigrants from Pakistan within a typical geography, there is an increase of 0.37% in percentage of population with at least ged/equivalency education.
It is essential to understand that the correlation between the percentage of Immigrants from Pakistan and percentage of population with at least ged/equivalency education does not imply a direct cause-and-effect relationship. It remains uncertain whether the presence of Immigrants from Pakistan influences an upward or downward trend in the level of percentage of population with at least ged/equivalency education within an area, or if Immigrants from Pakistan simply ended up residing in those areas with higher or lower levels of percentage of population with at least ged/equivalency education due to other factors.
Demographics Similar to Immigrants from Pakistan by GED/Equivalency
In terms of ged/equivalency, the demographic groups most similar to Immigrants from Pakistan are Immigrants from Indonesia (86.4%, a difference of 0.0%), Bolivian (86.4%, a difference of 0.010%), Laotian (86.5%, a difference of 0.030%), Paraguayan (86.5%, a difference of 0.060%), and Pakistani (86.4%, a difference of 0.070%).
| Demographics | Rating | Rank | GED/Equivalency |
| Chileans | 86.9 /100 | #136 | Excellent 86.6% |
| Arabs | 86.7 /100 | #137 | Excellent 86.6% |
| Immigrants from Argentina | 86.5 /100 | #138 | Excellent 86.6% |
| Immigrants from Malaysia | 85.0 /100 | #139 | Excellent 86.5% |
| Paraguayans | 84.1 /100 | #140 | Excellent 86.5% |
| Laotians | 83.2 /100 | #141 | Excellent 86.5% |
| Immigrants from Indonesia | 82.4 /100 | #142 | Excellent 86.4% |
| Immigrants from Pakistan | 82.4 /100 | #143 | Excellent 86.4% |
| Bolivians | 82.1 /100 | #144 | Excellent 86.4% |
| Pakistanis | 80.4 /100 | #145 | Excellent 86.4% |
| Basques | 79.5 /100 | #146 | Good 86.4% |
| Immigrants from Northern Africa | 79.3 /100 | #147 | Good 86.3% |
| Immigrants from Poland | 79.3 /100 | #148 | Good 86.3% |
| Menominee | 79.3 /100 | #149 | Good 86.3% |
| Immigrants from Western Asia | 78.8 /100 | #150 | Good 86.3% |
Immigrants from Pakistan GED/Equivalency Correlation Summary
| Measurement | Immigrants from Pakistan Data | GED/Equivalency Data |
| Minimum | 0.041% | 70.4% |
| Maximum | 35.2% | 100.0% |
| Range | 35.2% | 29.6% |
| Mean | 4.0% | 86.4% |
| Median | 2.9% | 87.0% |
| Interquartile 25% (IQ1) | 1.4% | 84.4% |
| Interquartile 75% (IQ3) | 4.9% | 88.9% |
| Interquartile Range (IQR) | 3.4% | 4.5% |
| Standard Deviation (Sample) | 4.8% | 5.3% |
| Standard Deviation (Population) | 4.8% | 5.2% |
Correlation Details
| Immigrants from Pakistan Percentile | Sample Size | GED/Equivalency |
[ 0.0% - 0.5% ] 0.041% | 111,882,577 | 84.6% |
[ 0.0% - 0.5% ] 0.12% | 56,141,109 | 86.6% |
[ 0.0% - 0.5% ] 0.20% | 33,848,782 | 86.0% |
[ 0.0% - 0.5% ] 0.29% | 19,884,777 | 86.1% |
[ 0.0% - 0.5% ] 0.37% | 11,377,374 | 88.6% |
[ 0.0% - 0.5% ] 0.44% | 17,253,186 | 83.8% |
[ 0.5% - 1.0% ] 0.53% | 5,846,929 | 87.8% |
[ 0.5% - 1.0% ] 0.61% | 4,269,358 | 87.1% |
[ 0.5% - 1.0% ] 0.69% | 3,431,642 | 90.5% |
[ 0.5% - 1.0% ] 0.77% | 2,836,711 | 87.0% |
[ 0.5% - 1.0% ] 0.86% | 2,145,559 | 88.8% |
[ 0.5% - 1.0% ] 0.92% | 3,033,377 | 87.0% |
[ 1.0% - 1.5% ] 1.02% | 1,738,290 | 88.3% |
[ 1.0% - 1.5% ] 1.10% | 839,576 | 86.2% |
[ 1.0% - 1.5% ] 1.19% | 984,346 | 86.3% |
[ 1.0% - 1.5% ] 1.26% | 1,342,858 | 87.4% |
[ 1.0% - 1.5% ] 1.35% | 678,326 | 88.4% |
[ 1.0% - 1.5% ] 1.43% | 517,882 | 87.1% |
[ 1.5% - 2.0% ] 1.51% | 657,050 | 88.3% |
[ 1.5% - 2.0% ] 1.59% | 474,246 | 89.1% |
[ 1.5% - 2.0% ] 1.67% | 505,976 | 87.0% |
[ 1.5% - 2.0% ] 1.76% | 243,183 | 88.4% |
[ 1.5% - 2.0% ] 1.83% | 413,327 | 88.5% |
[ 1.5% - 2.0% ] 1.91% | 195,966 | 84.4% |
[ 2.0% - 2.5% ] 2.01% | 123,228 | 85.5% |
[ 2.0% - 2.5% ] 2.09% | 157,869 | 87.9% |
[ 2.0% - 2.5% ] 2.17% | 386,225 | 85.6% |
[ 2.0% - 2.5% ] 2.24% | 363,594 | 81.1% |
[ 2.0% - 2.5% ] 2.33% | 135,957 | 83.2% |
[ 2.0% - 2.5% ] 2.42% | 206,771 | 84.7% |
[ 2.0% - 2.5% ] 2.50% | 254,522 | 84.6% |
[ 2.5% - 3.0% ] 2.57% | 73,701 | 84.0% |
[ 2.5% - 3.0% ] 2.66% | 76,966 | 70.7% |
[ 2.5% - 3.0% ] 2.72% | 99,561 | 85.0% |
[ 2.5% - 3.0% ] 2.83% | 99,677 | 91.2% |
[ 2.5% - 3.0% ] 2.89% | 178,062 | 83.5% |
[ 2.5% - 3.0% ] 2.97% | 39,329 | 81.5% |
[ 3.0% - 3.5% ] 3.04% | 129,420 | 85.7% |
[ 3.0% - 3.5% ] 3.16% | 67,044 | 90.9% |
[ 3.0% - 3.5% ] 3.23% | 32,104 | 84.9% |
[ 3.0% - 3.5% ] 3.32% | 36,559 | 84.2% |
[ 3.0% - 3.5% ] 3.36% | 134,107 | 85.3% |
[ 3.0% - 3.5% ] 3.46% | 109,978 | 80.9% |
[ 3.5% - 4.0% ] 3.56% | 18,357 | 87.2% |
[ 3.5% - 4.0% ] 3.61% | 63,183 | 86.6% |
[ 3.5% - 4.0% ] 3.70% | 86,647 | 81.9% |
[ 3.5% - 4.0% ] 3.78% | 123,078 | 92.6% |
[ 3.5% - 4.0% ] 3.85% | 9,567 | 70.4% |
[ 4.0% - 4.5% ] 4.08% | 4,265 | 90.5% |
[ 4.0% - 4.5% ] 4.10% | 31,609 | 92.7% |
[ 4.0% - 4.5% ] 4.48% | 1,406 | 90.6% |
[ 4.5% - 5.0% ] 4.60% | 50,245 | 72.3% |
[ 4.5% - 5.0% ] 4.70% | 12,209 | 74.5% |
[ 4.5% - 5.0% ] 4.88% | 17,793 | 87.2% |
[ 4.5% - 5.0% ] 4.97% | 95,920 | 93.1% |
[ 5.0% - 5.5% ] 5.32% | 30,553 | 82.9% |
[ 5.0% - 5.5% ] 5.43% | 13,010 | 86.8% |
[ 5.5% - 6.0% ] 5.66% | 10,990 | 85.3% |
[ 6.0% - 6.5% ] 6.26% | 1,502 | 83.5% |
[ 6.5% - 7.0% ] 6.64% | 76,600 | 89.2% |
[ 6.5% - 7.0% ] 6.70% | 1,374 | 83.7% |
[ 6.5% - 7.0% ] 6.80% | 3,296 | 90.0% |
[ 6.5% - 7.0% ] 6.99% | 143 | 88.0% |
[ 7.0% - 7.5% ] 7.07% | 2,533 | 97.7% |
[ 7.0% - 7.5% ] 7.29% | 329 | 88.9% |
[ 7.0% - 7.5% ] 7.46% | 3,002 | 90.0% |
[ 9.0% - 9.5% ] 9.18% | 2,135 | 90.2% |
[ 10.0% - 10.5% ] 10.08% | 5,803 | 90.0% |
[ 13.0% - 13.5% ] 13.40% | 194 | 77.4% |
[ 16.0% - 16.5% ] 16.33% | 49 | 100.0% |
[ 35.0% - 35.5% ] 35.25% | 122 | 100.0% |