Immigrants from Pakistan 1 or more Vehicles in Household
COMPARE
Immigrants from Pakistan
Select to Compare
1 or more Vehicles in Household
Immigrants from Pakistan 1 or more Vehicles in Household
88.6%
1+ VEHICLES AVAILABLE
4.5/ 100
METRIC RATING
236th/ 347
METRIC RANK
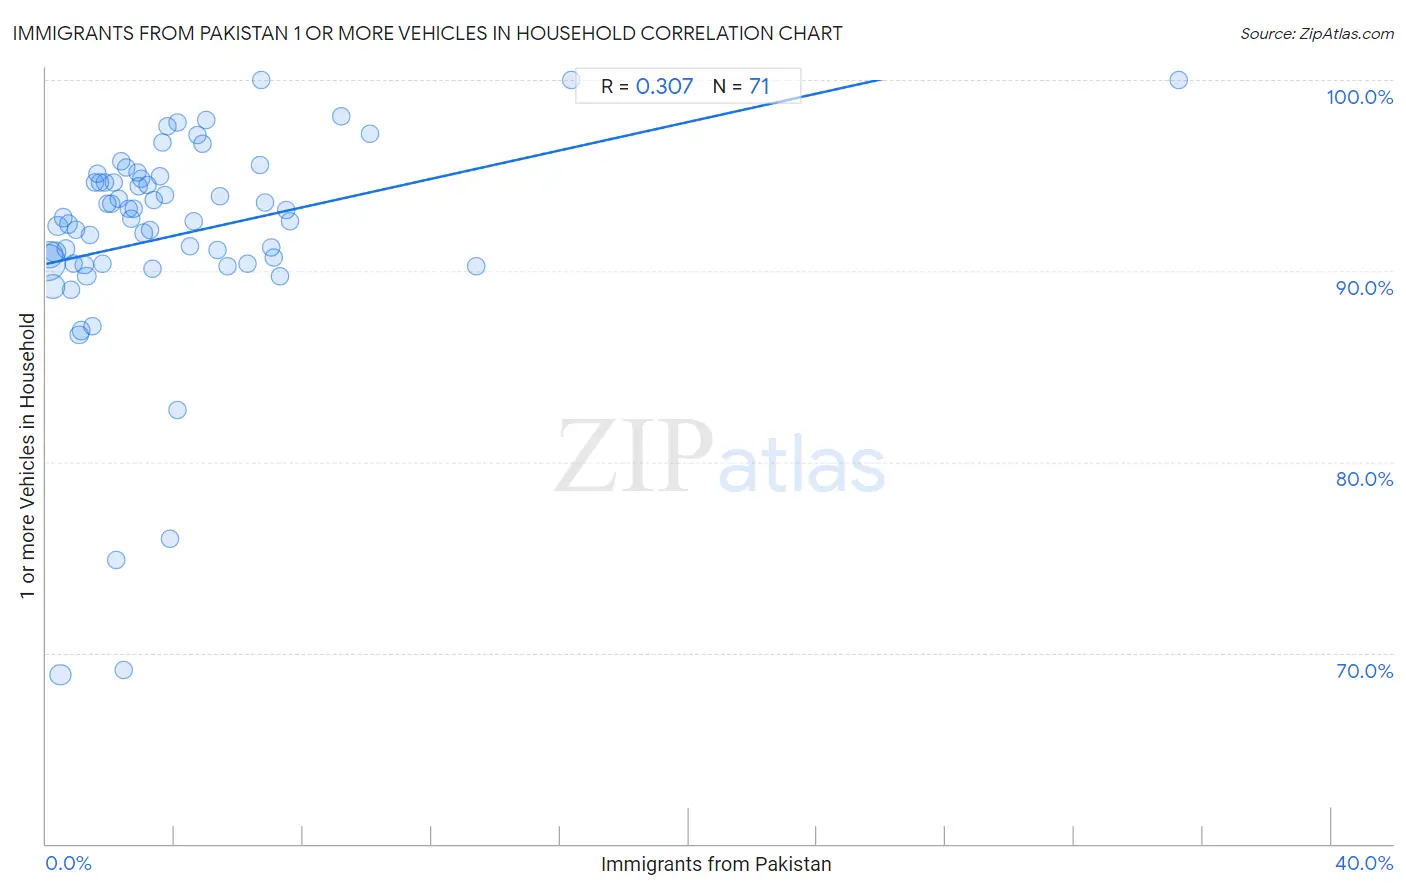
Immigrants from Pakistan 1 or more Vehicles in Household Correlation Chart
The statistical analysis conducted on geographies consisting of 283,704,699 people shows a mild positive correlation between the proportion of Immigrants from Pakistan and percentage of households with 1 or more vehicles available in the United States with a correlation coefficient (R) of 0.307 and weighted average of 88.6%. On average, for every 1% (one percent) increase in Immigrants from Pakistan within a typical geography, there is an increase of 0.37% in percentage of households with 1 or more vehicles available.
It is essential to understand that the correlation between the percentage of Immigrants from Pakistan and percentage of households with 1 or more vehicles available does not imply a direct cause-and-effect relationship. It remains uncertain whether the presence of Immigrants from Pakistan influences an upward or downward trend in the level of percentage of households with 1 or more vehicles available within an area, or if Immigrants from Pakistan simply ended up residing in those areas with higher or lower levels of percentage of households with 1 or more vehicles available due to other factors.
Demographics Similar to Immigrants from Pakistan by 1 or more Vehicles in Household
In terms of 1 or more vehicles in household, the demographic groups most similar to Immigrants from Pakistan are Paiute (88.6%, a difference of 0.010%), Immigrants from Turkey (88.6%, a difference of 0.010%), Immigrants from Peru (88.6%, a difference of 0.020%), Houma (88.6%, a difference of 0.030%), and Immigrants from Somalia (88.6%, a difference of 0.030%).
| Demographics | Rating | Rank | 1 or more Vehicles in Household |
| Immigrants from Romania | 5.4 /100 | #229 | Tragic 88.7% |
| Immigrants from Sierra Leone | 5.2 /100 | #230 | Tragic 88.7% |
| Russians | 5.0 /100 | #231 | Tragic 88.7% |
| Immigrants from Japan | 4.9 /100 | #232 | Tragic 88.7% |
| Houma | 4.8 /100 | #233 | Tragic 88.6% |
| Immigrants from Peru | 4.7 /100 | #234 | Tragic 88.6% |
| Paiute | 4.6 /100 | #235 | Tragic 88.6% |
| Immigrants from Pakistan | 4.5 /100 | #236 | Tragic 88.6% |
| Immigrants from Turkey | 4.4 /100 | #237 | Tragic 88.6% |
| Immigrants from Somalia | 4.2 /100 | #238 | Tragic 88.6% |
| Kiowa | 3.8 /100 | #239 | Tragic 88.6% |
| Eastern Europeans | 3.0 /100 | #240 | Tragic 88.5% |
| Taiwanese | 2.6 /100 | #241 | Tragic 88.4% |
| Turks | 2.5 /100 | #242 | Tragic 88.4% |
| Immigrants from Belgium | 2.1 /100 | #243 | Tragic 88.4% |
Immigrants from Pakistan 1 or more Vehicles in Household Correlation Summary
| Measurement | Immigrants from Pakistan Data | 1 or more Vehicles in Household Data |
| Minimum | 0.041% | 68.8% |
| Maximum | 35.2% | 100.0% |
| Range | 35.2% | 31.2% |
| Mean | 4.0% | 91.9% |
| Median | 2.9% | 92.7% |
| Interquartile 25% (IQ1) | 1.4% | 90.4% |
| Interquartile 75% (IQ3) | 5.0% | 94.8% |
| Interquartile Range (IQR) | 3.5% | 4.4% |
| Standard Deviation (Sample) | 4.8% | 5.9% |
| Standard Deviation (Population) | 4.8% | 5.8% |
Correlation Details
| Immigrants from Pakistan Percentile | Sample Size | 1 or more Vehicles in Household |
[ 0.0% - 0.5% ] 0.041% | 111,861,124 | 90.5% |
[ 0.0% - 0.5% ] 0.12% | 56,132,689 | 90.9% |
[ 0.0% - 0.5% ] 0.20% | 33,823,554 | 89.2% |
[ 0.0% - 0.5% ] 0.29% | 19,878,175 | 91.0% |
[ 0.0% - 0.5% ] 0.37% | 11,369,713 | 92.3% |
[ 0.0% - 0.5% ] 0.44% | 17,253,186 | 68.8% |
[ 0.5% - 1.0% ] 0.53% | 5,839,435 | 92.8% |
[ 0.5% - 1.0% ] 0.61% | 4,261,593 | 91.1% |
[ 0.5% - 1.0% ] 0.69% | 3,431,642 | 92.4% |
[ 0.5% - 1.0% ] 0.77% | 2,836,711 | 89.0% |
[ 0.5% - 1.0% ] 0.86% | 2,145,559 | 90.4% |
[ 0.5% - 1.0% ] 0.92% | 3,028,492 | 92.1% |
[ 1.0% - 1.5% ] 1.02% | 1,733,786 | 86.7% |
[ 1.0% - 1.5% ] 1.10% | 836,684 | 86.9% |
[ 1.0% - 1.5% ] 1.19% | 984,346 | 90.3% |
[ 1.0% - 1.5% ] 1.26% | 1,342,300 | 89.7% |
[ 1.0% - 1.5% ] 1.35% | 678,326 | 91.9% |
[ 1.0% - 1.5% ] 1.43% | 517,882 | 87.1% |
[ 1.5% - 2.0% ] 1.51% | 657,050 | 94.7% |
[ 1.5% - 2.0% ] 1.59% | 474,246 | 95.1% |
[ 1.5% - 2.0% ] 1.67% | 505,976 | 94.6% |
[ 1.5% - 2.0% ] 1.76% | 242,728 | 90.4% |
[ 1.5% - 2.0% ] 1.83% | 413,327 | 94.6% |
[ 1.5% - 2.0% ] 1.91% | 195,966 | 93.5% |
[ 2.0% - 2.5% ] 2.01% | 123,228 | 93.5% |
[ 2.0% - 2.5% ] 2.09% | 157,869 | 94.6% |
[ 2.0% - 2.5% ] 2.17% | 386,225 | 74.8% |
[ 2.0% - 2.5% ] 2.24% | 363,594 | 93.8% |
[ 2.0% - 2.5% ] 2.33% | 135,957 | 95.7% |
[ 2.0% - 2.5% ] 2.42% | 206,771 | 69.1% |
[ 2.0% - 2.5% ] 2.50% | 254,522 | 95.4% |
[ 2.5% - 3.0% ] 2.57% | 73,701 | 93.3% |
[ 2.5% - 3.0% ] 2.66% | 76,966 | 92.7% |
[ 2.5% - 3.0% ] 2.72% | 99,561 | 93.2% |
[ 2.5% - 3.0% ] 2.83% | 99,677 | 95.2% |
[ 2.5% - 3.0% ] 2.89% | 178,062 | 94.4% |
[ 2.5% - 3.0% ] 2.97% | 38,862 | 94.8% |
[ 3.0% - 3.5% ] 3.04% | 129,420 | 92.0% |
[ 3.0% - 3.5% ] 3.16% | 67,044 | 94.5% |
[ 3.0% - 3.5% ] 3.23% | 32,104 | 92.2% |
[ 3.0% - 3.5% ] 3.32% | 36,559 | 90.1% |
[ 3.0% - 3.5% ] 3.36% | 134,107 | 93.7% |
[ 3.5% - 4.0% ] 3.56% | 18,357 | 95.0% |
[ 3.5% - 4.0% ] 3.61% | 63,183 | 96.8% |
[ 3.5% - 4.0% ] 3.70% | 86,647 | 94.0% |
[ 3.5% - 4.0% ] 3.78% | 123,078 | 97.6% |
[ 3.5% - 4.0% ] 3.85% | 9,567 | 76.0% |
[ 4.0% - 4.5% ] 4.08% | 4,265 | 82.7% |
[ 4.0% - 4.5% ] 4.10% | 31,609 | 97.8% |
[ 4.0% - 4.5% ] 4.48% | 1,406 | 91.3% |
[ 4.5% - 5.0% ] 4.60% | 50,245 | 92.6% |
[ 4.5% - 5.0% ] 4.70% | 12,209 | 97.1% |
[ 4.5% - 5.0% ] 4.88% | 17,793 | 96.7% |
[ 4.5% - 5.0% ] 4.97% | 95,920 | 97.9% |
[ 5.0% - 5.5% ] 5.32% | 30,553 | 91.1% |
[ 5.0% - 5.5% ] 5.43% | 13,010 | 93.9% |
[ 5.5% - 6.0% ] 5.66% | 10,990 | 90.2% |
[ 6.0% - 6.5% ] 6.26% | 1,502 | 90.4% |
[ 6.5% - 7.0% ] 6.64% | 76,600 | 95.5% |
[ 6.5% - 7.0% ] 6.70% | 1,374 | 100.0% |
[ 6.5% - 7.0% ] 6.80% | 3,296 | 93.6% |
[ 6.5% - 7.0% ] 6.99% | 143 | 91.2% |
[ 7.0% - 7.5% ] 7.07% | 2,533 | 90.7% |
[ 7.0% - 7.5% ] 7.29% | 329 | 89.7% |
[ 7.0% - 7.5% ] 7.46% | 3,002 | 93.2% |
[ 7.5% - 8.0% ] 7.58% | 66 | 92.6% |
[ 9.0% - 9.5% ] 9.18% | 2,135 | 98.1% |
[ 10.0% - 10.5% ] 10.08% | 5,803 | 97.2% |
[ 13.0% - 13.5% ] 13.40% | 194 | 90.3% |
[ 16.0% - 16.5% ] 16.33% | 49 | 100.0% |
[ 35.0% - 35.5% ] 35.25% | 122 | 100.0% |