Immigrants from Lithuania 2 or more Vehicles in Household
COMPARE
Immigrants from Lithuania
Select to Compare
2 or more Vehicles in Household
Immigrants from Lithuania 2 or more Vehicles in Household
55.8%
2+ VEHICLES AVAILABLE
70.4/ 100
METRIC RATING
156th/ 347
METRIC RANK
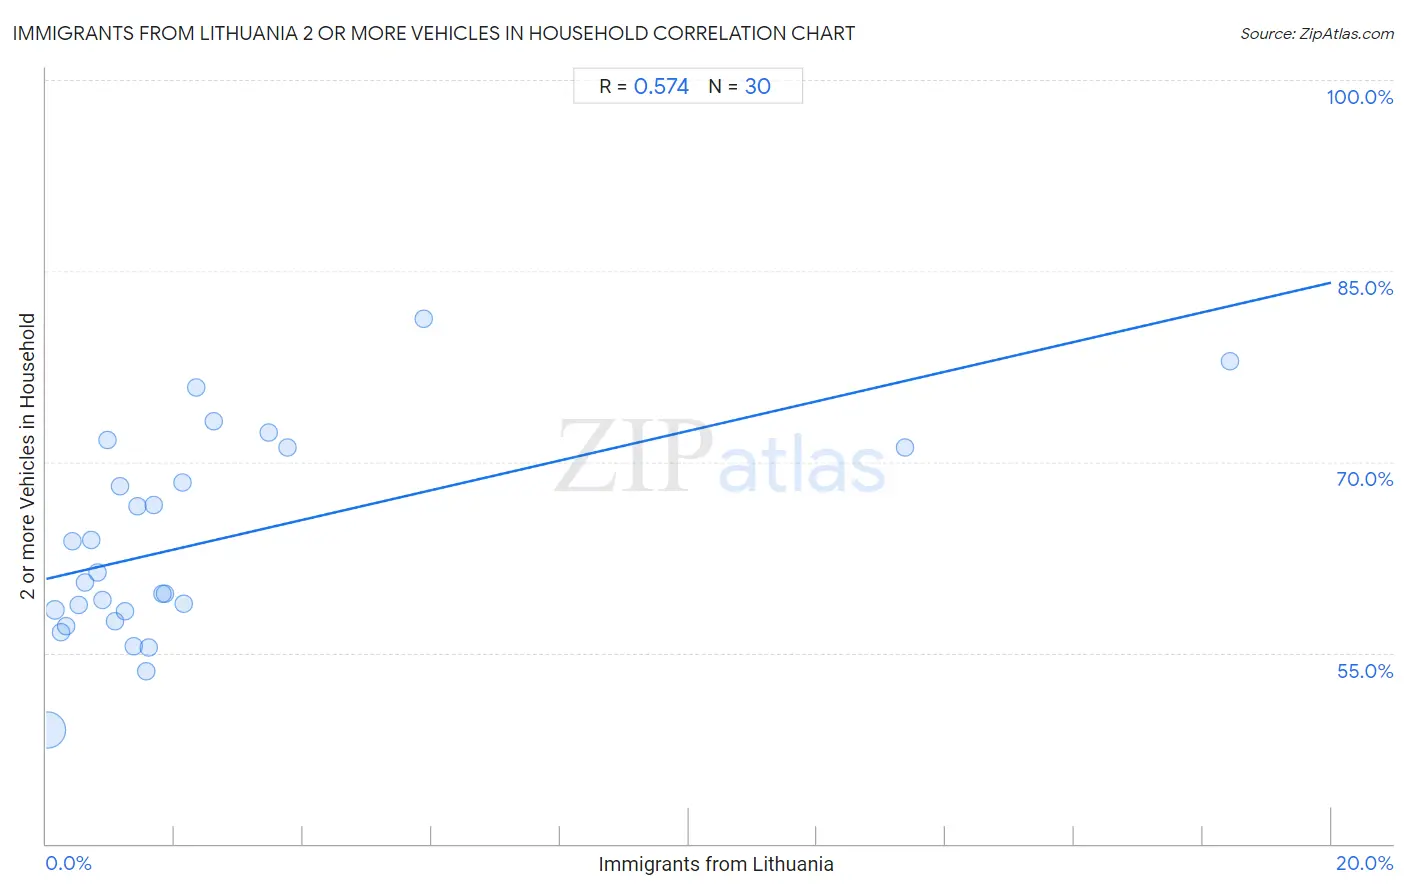
Immigrants from Lithuania 2 or more Vehicles in Household Correlation Chart
The statistical analysis conducted on geographies consisting of 117,713,976 people shows a substantial positive correlation between the proportion of Immigrants from Lithuania and percentage of households with 2 or more vehicles available in the United States with a correlation coefficient (R) of 0.574 and weighted average of 55.8%. On average, for every 1% (one percent) increase in Immigrants from Lithuania within a typical geography, there is an increase of 1.2% in percentage of households with 2 or more vehicles available.
It is essential to understand that the correlation between the percentage of Immigrants from Lithuania and percentage of households with 2 or more vehicles available does not imply a direct cause-and-effect relationship. It remains uncertain whether the presence of Immigrants from Lithuania influences an upward or downward trend in the level of percentage of households with 2 or more vehicles available within an area, or if Immigrants from Lithuania simply ended up residing in those areas with higher or lower levels of percentage of households with 2 or more vehicles available due to other factors.
Demographics Similar to Immigrants from Lithuania by 2 or more Vehicles in Household
In terms of 2 or more vehicles in household, the demographic groups most similar to Immigrants from Lithuania are Immigrants from Venezuela (55.8%, a difference of 0.010%), Immigrants from Kuwait (55.8%, a difference of 0.010%), Ukrainian (55.8%, a difference of 0.020%), Lumbee (55.9%, a difference of 0.070%), and Tlingit-Haida (55.8%, a difference of 0.090%).
| Demographics | Rating | Rank | 2 or more Vehicles in Household |
| Chileans | 80.2 /100 | #149 | Excellent 56.1% |
| Nicaraguans | 79.9 /100 | #150 | Good 56.1% |
| Immigrants from Northern Europe | 78.7 /100 | #151 | Good 56.1% |
| Immigrants from Pakistan | 78.1 /100 | #152 | Good 56.1% |
| Lumbee | 71.9 /100 | #153 | Good 55.9% |
| Ukrainians | 70.8 /100 | #154 | Good 55.8% |
| Immigrants from Venezuela | 70.7 /100 | #155 | Good 55.8% |
| Immigrants from Lithuania | 70.4 /100 | #156 | Good 55.8% |
| Immigrants from Kuwait | 70.2 /100 | #157 | Good 55.8% |
| Tlingit-Haida | 68.5 /100 | #158 | Good 55.8% |
| Paiute | 68.0 /100 | #159 | Good 55.8% |
| Crow | 67.0 /100 | #160 | Good 55.7% |
| Colville | 61.1 /100 | #161 | Good 55.6% |
| German Russians | 60.9 /100 | #162 | Good 55.6% |
| Immigrants from Zimbabwe | 60.2 /100 | #163 | Good 55.6% |
Immigrants from Lithuania 2 or more Vehicles in Household Correlation Summary
| Measurement | Immigrants from Lithuania Data | 2 or more Vehicles in Household Data |
| Minimum | 0.022% | 49.0% |
| Maximum | 18.4% | 81.2% |
| Range | 18.4% | 32.3% |
| Mean | 2.5% | 63.7% |
| Median | 1.4% | 60.9% |
| Interquartile 25% (IQ1) | 0.69% | 58.2% |
| Interquartile 75% (IQ3) | 2.1% | 71.1% |
| Interquartile Range (IQR) | 1.5% | 12.9% |
| Standard Deviation (Sample) | 3.9% | 7.9% |
| Standard Deviation (Population) | 3.8% | 7.8% |
Correlation Details
| Immigrants from Lithuania Percentile | Sample Size | 2 or more Vehicles in Household |
[ 0.0% - 0.5% ] 0.022% | 102,984,532 | 49.0% |
[ 0.0% - 0.5% ] 0.13% | 8,126,957 | 58.4% |
[ 0.0% - 0.5% ] 0.23% | 3,211,708 | 56.6% |
[ 0.0% - 0.5% ] 0.31% | 1,266,927 | 57.1% |
[ 0.0% - 0.5% ] 0.41% | 561,608 | 63.8% |
[ 0.0% - 0.5% ] 0.50% | 361,539 | 58.8% |
[ 0.5% - 1.0% ] 0.61% | 271,351 | 60.5% |
[ 0.5% - 1.0% ] 0.69% | 192,841 | 63.9% |
[ 0.5% - 1.0% ] 0.80% | 72,017 | 61.3% |
[ 0.5% - 1.0% ] 0.87% | 134,524 | 59.2% |
[ 0.5% - 1.0% ] 0.96% | 19,741 | 71.7% |
[ 1.0% - 1.5% ] 1.06% | 58,904 | 57.5% |
[ 1.0% - 1.5% ] 1.14% | 122,775 | 68.1% |
[ 1.0% - 1.5% ] 1.22% | 6,743 | 58.2% |
[ 1.0% - 1.5% ] 1.36% | 38,572 | 55.5% |
[ 1.0% - 1.5% ] 1.43% | 55,353 | 66.5% |
[ 1.5% - 2.0% ] 1.55% | 28,061 | 53.5% |
[ 1.5% - 2.0% ] 1.59% | 44,406 | 55.4% |
[ 1.5% - 2.0% ] 1.67% | 12,778 | 66.6% |
[ 1.5% - 2.0% ] 1.82% | 16,833 | 59.6% |
[ 1.5% - 2.0% ] 1.85% | 51,206 | 59.6% |
[ 2.0% - 2.5% ] 2.12% | 5,862 | 68.4% |
[ 2.0% - 2.5% ] 2.14% | 10,443 | 58.8% |
[ 2.0% - 2.5% ] 2.33% | 10,268 | 75.8% |
[ 2.5% - 3.0% ] 2.60% | 1,536 | 73.2% |
[ 3.0% - 3.5% ] 3.47% | 26,810 | 72.3% |
[ 3.5% - 4.0% ] 3.76% | 18,533 | 71.1% |
[ 5.5% - 6.0% ] 5.88% | 187 | 81.2% |
[ 13.0% - 13.5% ] 13.36% | 494 | 71.2% |
[ 18.0% - 18.5% ] 18.42% | 467 | 77.9% |