Immigrants from Lithuania Married-couple Households
COMPARE
Immigrants from Lithuania
Select to Compare
Married-couple Households
Immigrants from Lithuania Married-couple Households
48.6%
MARRIED-COUPLE HOUSEHOLDS
99.3/ 100
METRIC RATING
54th/ 347
METRIC RANK
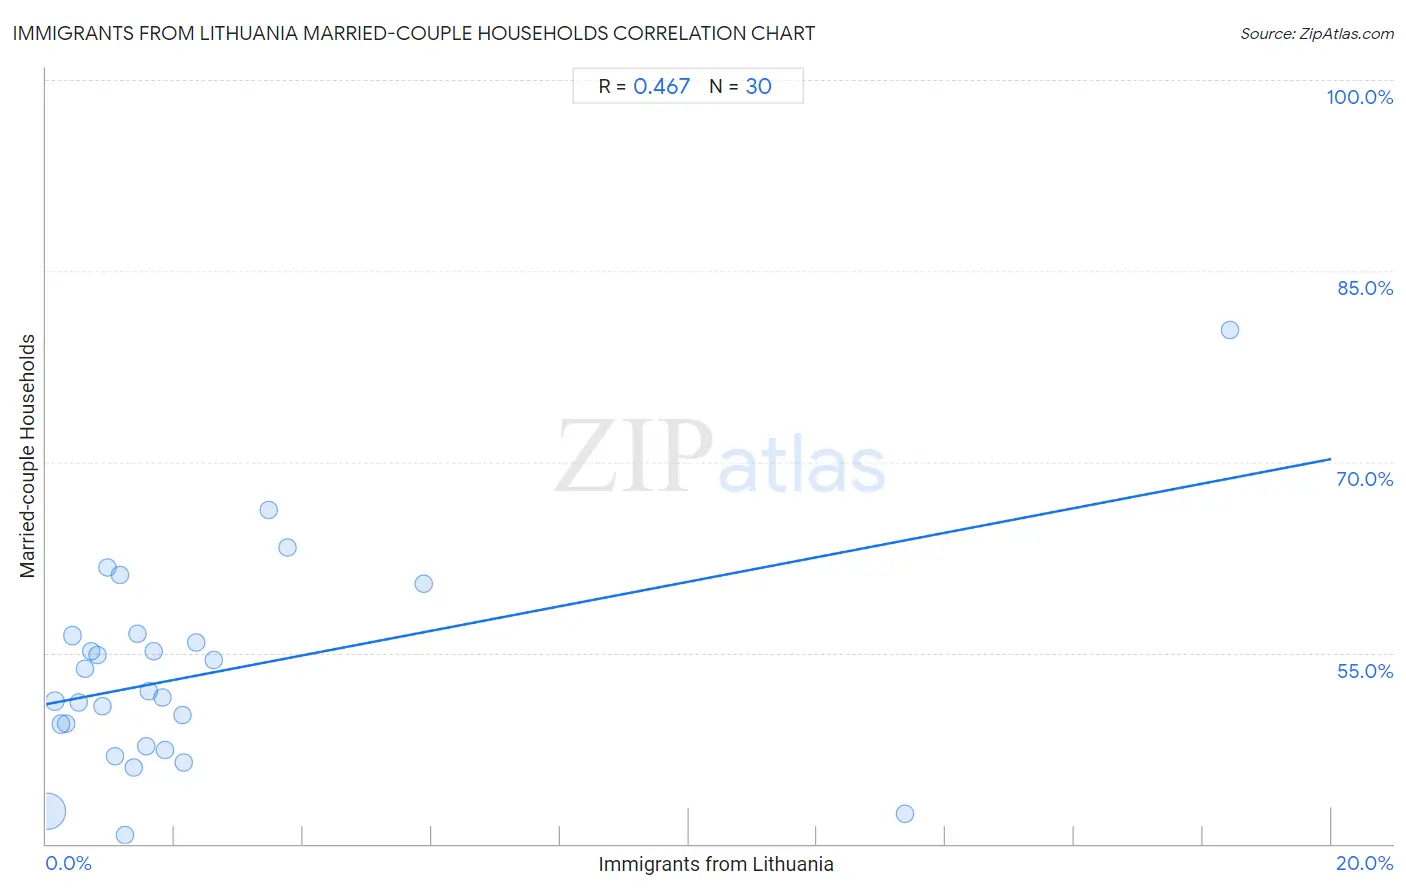
Immigrants from Lithuania Married-couple Households Correlation Chart
The statistical analysis conducted on geographies consisting of 117,713,976 people shows a moderate positive correlation between the proportion of Immigrants from Lithuania and percentage of married-couple family households in the United States with a correlation coefficient (R) of 0.467 and weighted average of 48.6%. On average, for every 1% (one percent) increase in Immigrants from Lithuania within a typical geography, there is an increase of 0.96% in percentage of married-couple family households.
It is essential to understand that the correlation between the percentage of Immigrants from Lithuania and percentage of married-couple family households does not imply a direct cause-and-effect relationship. It remains uncertain whether the presence of Immigrants from Lithuania influences an upward or downward trend in the level of percentage of married-couple family households within an area, or if Immigrants from Lithuania simply ended up residing in those areas with higher or lower levels of percentage of married-couple family households due to other factors.
Demographics Similar to Immigrants from Lithuania by Married-couple Households
In terms of married-couple households, the demographic groups most similar to Immigrants from Lithuania are White/Caucasian (48.6%, a difference of 0.010%), Austrian (48.6%, a difference of 0.010%), Immigrants from Northern Europe (48.6%, a difference of 0.010%), Irish (48.6%, a difference of 0.060%), and Eastern European (48.6%, a difference of 0.090%).
| Demographics | Rating | Rank | Married-couple Households |
| British | 99.5 /100 | #47 | Exceptional 48.7% |
| Indians (Asian) | 99.4 /100 | #48 | Exceptional 48.7% |
| Immigrants from Sri Lanka | 99.4 /100 | #49 | Exceptional 48.7% |
| Samoans | 99.4 /100 | #50 | Exceptional 48.7% |
| Eastern Europeans | 99.3 /100 | #51 | Exceptional 48.6% |
| Irish | 99.3 /100 | #52 | Exceptional 48.6% |
| Whites/Caucasians | 99.3 /100 | #53 | Exceptional 48.6% |
| Immigrants from Lithuania | 99.3 /100 | #54 | Exceptional 48.6% |
| Austrians | 99.3 /100 | #55 | Exceptional 48.6% |
| Immigrants from Northern Europe | 99.3 /100 | #56 | Exceptional 48.6% |
| Poles | 99.2 /100 | #57 | Exceptional 48.5% |
| Immigrants from Indonesia | 99.2 /100 | #58 | Exceptional 48.5% |
| Czechoslovakians | 99.2 /100 | #59 | Exceptional 48.5% |
| Croatians | 99.1 /100 | #60 | Exceptional 48.5% |
| Bulgarians | 99.1 /100 | #61 | Exceptional 48.5% |
Immigrants from Lithuania Married-couple Households Correlation Summary
| Measurement | Immigrants from Lithuania Data | Married-couple Households Data |
| Minimum | 0.022% | 40.7% |
| Maximum | 18.4% | 80.4% |
| Range | 18.4% | 39.7% |
| Mean | 2.5% | 53.3% |
| Median | 1.4% | 51.7% |
| Interquartile 25% (IQ1) | 0.69% | 47.6% |
| Interquartile 75% (IQ3) | 2.1% | 56.4% |
| Interquartile Range (IQR) | 1.5% | 8.7% |
| Standard Deviation (Sample) | 3.9% | 8.1% |
| Standard Deviation (Population) | 3.8% | 7.9% |
Correlation Details
| Immigrants from Lithuania Percentile | Sample Size | Married-couple Households |
[ 0.0% - 0.5% ] 0.022% | 102,984,532 | 42.6% |
[ 0.0% - 0.5% ] 0.13% | 8,126,957 | 51.2% |
[ 0.0% - 0.5% ] 0.23% | 3,211,708 | 49.4% |
[ 0.0% - 0.5% ] 0.31% | 1,266,927 | 49.4% |
[ 0.0% - 0.5% ] 0.41% | 561,608 | 56.4% |
[ 0.0% - 0.5% ] 0.50% | 361,539 | 51.1% |
[ 0.5% - 1.0% ] 0.61% | 271,351 | 53.8% |
[ 0.5% - 1.0% ] 0.69% | 192,841 | 55.1% |
[ 0.5% - 1.0% ] 0.80% | 72,017 | 54.8% |
[ 0.5% - 1.0% ] 0.87% | 134,524 | 50.8% |
[ 0.5% - 1.0% ] 0.96% | 19,741 | 61.8% |
[ 1.0% - 1.5% ] 1.06% | 58,904 | 46.9% |
[ 1.0% - 1.5% ] 1.14% | 122,775 | 61.1% |
[ 1.0% - 1.5% ] 1.22% | 6,743 | 40.7% |
[ 1.0% - 1.5% ] 1.36% | 38,572 | 46.0% |
[ 1.0% - 1.5% ] 1.43% | 55,353 | 56.5% |
[ 1.5% - 2.0% ] 1.55% | 28,061 | 47.6% |
[ 1.5% - 2.0% ] 1.59% | 44,406 | 52.0% |
[ 1.5% - 2.0% ] 1.67% | 12,778 | 55.1% |
[ 1.5% - 2.0% ] 1.82% | 16,833 | 51.5% |
[ 1.5% - 2.0% ] 1.85% | 51,206 | 47.4% |
[ 2.0% - 2.5% ] 2.12% | 5,862 | 50.1% |
[ 2.0% - 2.5% ] 2.14% | 10,443 | 46.4% |
[ 2.0% - 2.5% ] 2.33% | 10,268 | 55.8% |
[ 2.5% - 3.0% ] 2.60% | 1,536 | 54.4% |
[ 3.0% - 3.5% ] 3.47% | 26,810 | 66.2% |
[ 3.5% - 4.0% ] 3.76% | 18,533 | 63.3% |
[ 5.5% - 6.0% ] 5.88% | 187 | 60.4% |
[ 13.0% - 13.5% ] 13.36% | 494 | 42.3% |
[ 18.0% - 18.5% ] 18.42% | 467 | 80.4% |