Immigrants from Lithuania Self-Care Disability
COMPARE
Immigrants from Lithuania
Select to Compare
Self-Care Disability
Immigrants from Lithuania Self-Care Disability
2.3%
SELF-CARE DISABILITY
99.9/ 100
METRIC RATING
36th/ 347
METRIC RANK
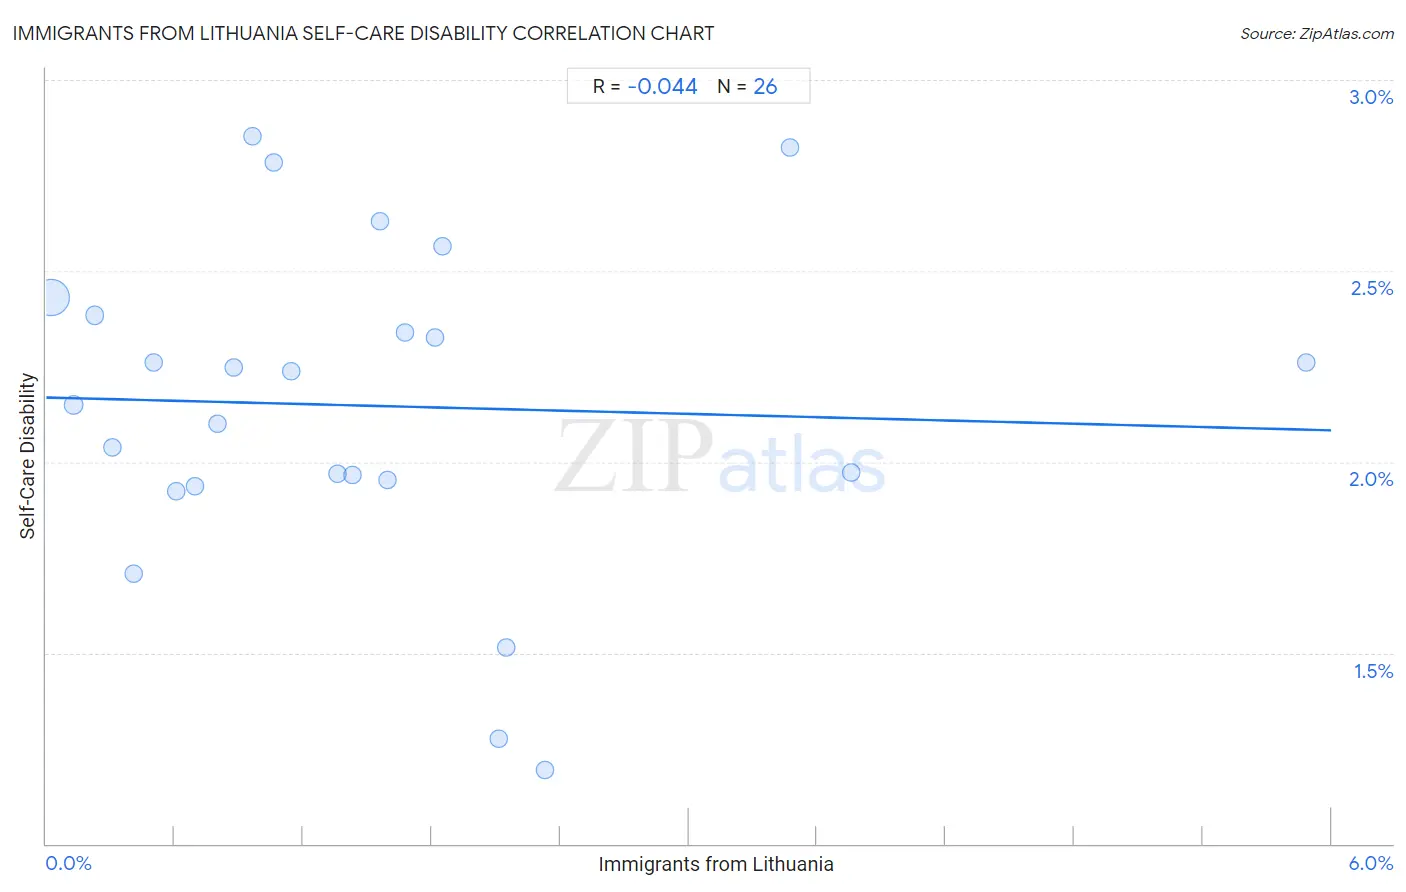
Immigrants from Lithuania Self-Care Disability Correlation Chart
The statistical analysis conducted on geographies consisting of 117,698,570 people shows no correlation between the proportion of Immigrants from Lithuania and percentage of population with self-care disability in the United States with a correlation coefficient (R) of -0.044 and weighted average of 2.3%. On average, for every 1% (one percent) increase in Immigrants from Lithuania within a typical geography, there is a decrease of 0.014% in percentage of population with self-care disability.
It is essential to understand that the correlation between the percentage of Immigrants from Lithuania and percentage of population with self-care disability does not imply a direct cause-and-effect relationship. It remains uncertain whether the presence of Immigrants from Lithuania influences an upward or downward trend in the level of percentage of population with self-care disability within an area, or if Immigrants from Lithuania simply ended up residing in those areas with higher or lower levels of percentage of population with self-care disability due to other factors.
Demographics Similar to Immigrants from Lithuania by Self-Care Disability
In terms of self-care disability, the demographic groups most similar to Immigrants from Lithuania are Immigrants from Australia (2.3%, a difference of 0.010%), Immigrants from Turkey (2.3%, a difference of 0.070%), Immigrants from Korea (2.3%, a difference of 0.13%), Immigrants from Sweden (2.3%, a difference of 0.17%), and Immigrants from Eastern Africa (2.3%, a difference of 0.30%).
| Demographics | Rating | Rank | Self-Care Disability |
| Immigrants from Zimbabwe | 99.9 /100 | #29 | Exceptional 2.3% |
| Paraguayans | 99.9 /100 | #30 | Exceptional 2.3% |
| Danes | 99.9 /100 | #31 | Exceptional 2.3% |
| Burmese | 99.9 /100 | #32 | Exceptional 2.3% |
| Immigrants from Korea | 99.9 /100 | #33 | Exceptional 2.3% |
| Immigrants from Turkey | 99.9 /100 | #34 | Exceptional 2.3% |
| Immigrants from Australia | 99.9 /100 | #35 | Exceptional 2.3% |
| Immigrants from Lithuania | 99.9 /100 | #36 | Exceptional 2.3% |
| Immigrants from Sweden | 99.9 /100 | #37 | Exceptional 2.3% |
| Immigrants from Eastern Africa | 99.9 /100 | #38 | Exceptional 2.3% |
| Immigrants from Bulgaria | 99.8 /100 | #39 | Exceptional 2.3% |
| Iranians | 99.8 /100 | #40 | Exceptional 2.3% |
| Immigrants from Sudan | 99.8 /100 | #41 | Exceptional 2.3% |
| Immigrants from Uganda | 99.8 /100 | #42 | Exceptional 2.3% |
| Immigrants from Pakistan | 99.8 /100 | #43 | Exceptional 2.3% |
Immigrants from Lithuania Self-Care Disability Correlation Summary
| Measurement | Immigrants from Lithuania Data | Self-Care Disability Data |
| Minimum | 0.022% | 1.2% |
| Maximum | 5.9% | 2.9% |
| Range | 5.9% | 1.7% |
| Mean | 1.5% | 2.1% |
| Median | 1.3% | 2.2% |
| Interquartile 25% (IQ1) | 0.61% | 2.0% |
| Interquartile 75% (IQ3) | 1.8% | 2.4% |
| Interquartile Range (IQR) | 1.2% | 0.43% |
| Standard Deviation (Sample) | 1.3% | 0.43% |
| Standard Deviation (Population) | 1.3% | 0.42% |
Correlation Details
| Immigrants from Lithuania Percentile | Sample Size | Self-Care Disability |
[ 0.0% - 0.5% ] 0.022% | 102,995,488 | 2.4% |
[ 0.0% - 0.5% ] 0.13% | 8,126,957 | 2.1% |
[ 0.0% - 0.5% ] 0.23% | 3,211,708 | 2.4% |
[ 0.0% - 0.5% ] 0.31% | 1,266,334 | 2.0% |
[ 0.0% - 0.5% ] 0.41% | 560,062 | 1.7% |
[ 0.0% - 0.5% ] 0.50% | 361,539 | 2.3% |
[ 0.5% - 1.0% ] 0.61% | 266,408 | 1.9% |
[ 0.5% - 1.0% ] 0.69% | 188,183 | 1.9% |
[ 0.5% - 1.0% ] 0.80% | 72,017 | 2.1% |
[ 0.5% - 1.0% ] 0.87% | 134,524 | 2.2% |
[ 0.5% - 1.0% ] 0.96% | 17,482 | 2.9% |
[ 1.0% - 1.5% ] 1.06% | 58,904 | 2.8% |
[ 1.0% - 1.5% ] 1.14% | 122,775 | 2.2% |
[ 1.0% - 1.5% ] 1.36% | 38,572 | 2.0% |
[ 1.0% - 1.5% ] 1.43% | 55,353 | 2.0% |
[ 1.5% - 2.0% ] 1.56% | 27,051 | 2.6% |
[ 1.5% - 2.0% ] 1.59% | 44,406 | 2.0% |
[ 1.5% - 2.0% ] 1.68% | 11,039 | 2.3% |
[ 1.5% - 2.0% ] 1.82% | 16,833 | 2.3% |
[ 1.5% - 2.0% ] 1.85% | 51,206 | 2.6% |
[ 2.0% - 2.5% ] 2.12% | 5,862 | 1.3% |
[ 2.0% - 2.5% ] 2.15% | 10,069 | 1.5% |
[ 2.0% - 2.5% ] 2.33% | 10,268 | 1.2% |
[ 3.0% - 3.5% ] 3.47% | 26,810 | 2.8% |
[ 3.5% - 4.0% ] 3.76% | 18,533 | 2.0% |
[ 5.5% - 6.0% ] 5.88% | 187 | 2.3% |