Immigrants from Lithuania GED/Equivalency

COMPARE

Immigrants from Lithuania
Race
Ancestry
AfghanAfricanAlaska NativeAlaskan AthabascanAlbanianAleutAlsatianAmericanApacheArabArapahoArgentineanArmenianAssyrian/Chaldean/SyriacAustralianAustrianBahamianBangladeshiBarbadianBasqueBelgianBelizeanBermudanBhutaneseBlackfeetBolivianBrazilianBritishBritish West IndianBulgarianBurmeseCajunCambodianCanadianCape VerdeanCarpatho RusynCelticCentral AmericanCentral American IndianCherokeeCheyenneChickasawChileanChineseChippewaChoctawColombianColvilleComancheCosta RicanCreeCreekCroatianCrowCubanCypriotCzechCzechoslovakianDanishDelawareDominicanDutchDutch West IndianEastern EuropeanEcuadorianEgyptianEnglishEstonianEthiopianEuropeanFijianFilipinoFinnishFrenchFrench American IndianFrench CanadianGermanGerman RussianGhanaianGreekGuamanian/ChamorroGuatemalanGuyaneseHaitianHmongHonduranHopiHoumaHungarianIcelanderIndian (Asian)IndonesianInupiatIranianIraqiIrishIroquoisIsraeliItalianJamaicanJapaneseJordanianKenyanKiowaKoreanLaotianLatvianLebaneseLiberianLithuanianLumbeeLuxembourgerMacedonianMalaysianMalteseMarshalleseMenomineeMexicanMexican American IndianMongolianMoroccanNative HawaiianNavajoNepaleseNew ZealanderNicaraguanNigerianNorthern EuropeanNorwegianOkinawanOsageOttawaPaiutePakistaniPalestinianPanamanianParaguayanPennsylvania GermanPeruvianPimaPolishPortuguesePotawatomiPuebloPuerto RicanPuget Sound SalishRomanianRussianSalvadoranSamoanScandinavianScotch-IrishScottishSeminoleSenegaleseSerbianShoshoneSierra LeoneanSiouxSlavicSlovakSloveneSomaliSouth AfricanSouth AmericanSouth American IndianSoviet UnionSpaniardSpanishSpanish AmericanSpanish American IndianSri LankanSubsaharan AfricanSudaneseSwedishSwissSyrianTaiwaneseThaiTlingit-HaidaTohono O'OdhamTonganTrinidadian and TobagonianTsimshianTurkishU.S. Virgin IslanderUgandanUkrainianUruguayanUteVenezuelanVietnameseWelshWest IndianYakamaYaquiYugoslavianYumanYup'ikZimbabwean
Immigration
NonimmigrantsImmigrantsAfghanistanAfricaAlbaniaArgentinaArmeniaAsiaAustraliaAustriaBahamasBangladeshBarbadosBelarusBelgiumBelizeBoliviaBosnia and HerzegovinaBrazilBulgariaBurma/MyanmarCabo VerdeCambodiaCameroonCanadaCaribbeanCentral AmericaChileChinaColombiaCongoCosta RicaCroatiaCubaCzechoslovakiaDenmarkDominicaDominican RepublicEastern AfricaEastern AsiaEastern EuropeEcuadorEgyptEl SalvadorEnglandEritreaEthiopiaEuropeFijiFranceGermanyGhanaGreeceGrenadaGuatemalaGuyanaHaitiHondurasHong KongHungaryIndiaIndonesiaIranIraqIrelandIsraelItalyJamaicaJapanJordanKazakhstanKenyaKoreaKuwaitLaosLatin AmericaLatviaLebanonLiberiaLithuaniaMalaysiaMexicoMicronesiaMiddle AfricaMoldovaMoroccoNepalNetherlandsNicaraguaNigeriaNorth AmericaNorth MacedoniaNorthern AfricaNorthern EuropeNorwayOceaniaPakistanPanamaPeruPhilippinesPolandPortugalRomaniaRussiaSaudi ArabiaScotlandSenegalSerbiaSierra LeoneSingaporeSomaliaSouth AfricaSouth AmericaSouth Central AsiaSouth Eastern AsiaSouthern EuropeSpainSri LankaSt. Vincent and the GrenadinesSudanSwedenSwitzerlandSyriaTaiwanThailandTrinidad and TobagoTurkeyUgandaUkraineUruguayUzbekistanVenezuelaVietnamWest IndiesWestern AfricaWestern AsiaWestern EuropeYemenZaireZimbabweAzores
Select to Compare
Race
Ancestry
AfghanAfricanAlaska NativeAlaskan AthabascanAlbanianAleutAlsatianAmericanApacheArabArapahoArgentineanArmenianAssyrian/Chaldean/SyriacAustralianAustrianBahamianBangladeshiBarbadianBasqueBelgianBelizeanBermudanBhutaneseBlackfeetBolivianBrazilianBritishBritish West IndianBulgarianBurmeseCajunCambodianCanadianCape VerdeanCarpatho RusynCelticCentral AmericanCentral American IndianCherokeeCheyenneChickasawChileanChineseChippewaChoctawColombianColvilleComancheCosta RicanCreeCreekCroatianCrowCubanCypriotCzechCzechoslovakianDanishDelawareDominicanDutchDutch West IndianEastern EuropeanEcuadorianEgyptianEnglishEstonianEthiopianEuropeanFijianFilipinoFinnishFrenchFrench American IndianFrench CanadianGermanGerman RussianGhanaianGreekGuamanian/ChamorroGuatemalanGuyaneseHaitianHmongHonduranHopiHoumaHungarianIcelanderIndian (Asian)IndonesianInupiatIranianIraqiIrishIroquoisIsraeliItalianJamaicanJapaneseJordanianKenyanKiowaKoreanLaotianLatvianLebaneseLiberianLithuanianLumbeeLuxembourgerMacedonianMalaysianMalteseMarshalleseMenomineeMexicanMexican American IndianMongolianMoroccanNative HawaiianNavajoNepaleseNew ZealanderNicaraguanNigerianNorthern EuropeanNorwegianOkinawanOsageOttawaPaiutePakistaniPalestinianPanamanianParaguayanPennsylvania GermanPeruvianPimaPolishPortuguesePotawatomiPuebloPuerto RicanPuget Sound SalishRomanianRussianSalvadoranSamoanScandinavianScotch-IrishScottishSeminoleSenegaleseSerbianShoshoneSierra LeoneanSiouxSlavicSlovakSloveneSomaliSouth AfricanSouth AmericanSouth American IndianSoviet UnionSpaniardSpanishSpanish AmericanSpanish American IndianSri LankanSubsaharan AfricanSudaneseSwedishSwissSyrianTaiwaneseThaiTlingit-HaidaTohono O'OdhamTonganTrinidadian and TobagonianTsimshianTurkishU.S. Virgin IslanderUgandanUkrainianUruguayanUteVenezuelanVietnameseWelshWest IndianYakamaYaquiYugoslavianYumanYup'ikZimbabwean
Immigration
NonimmigrantsImmigrantsAfghanistanAfricaAlbaniaArgentinaArmeniaAsiaAustraliaAustriaBahamasBangladeshBarbadosBelarusBelgiumBelizeBoliviaBosnia and HerzegovinaBrazilBulgariaBurma/MyanmarCabo VerdeCambodiaCameroonCanadaCaribbeanCentral AmericaChileChinaColombiaCongoCosta RicaCroatiaCubaCzechoslovakiaDenmarkDominicaDominican RepublicEastern AfricaEastern AsiaEastern EuropeEcuadorEgyptEl SalvadorEnglandEritreaEthiopiaEuropeFijiFranceGermanyGhanaGreeceGrenadaGuatemalaGuyanaHaitiHondurasHong KongHungaryIndiaIndonesiaIranIraqIrelandIsraelItalyJamaicaJapanJordanKazakhstanKenyaKoreaKuwaitLaosLatin AmericaLatviaLebanonLiberiaMalaysiaMexicoMicronesiaMiddle AfricaMoldovaMoroccoNepalNetherlandsNicaraguaNigeriaNorth AmericaNorth MacedoniaNorthern AfricaNorthern EuropeNorwayOceaniaPakistanPanamaPeruPhilippinesPolandPortugalRomaniaRussiaSaudi ArabiaScotlandSenegalSerbiaSierra LeoneSingaporeSomaliaSouth AfricaSouth AmericaSouth Central AsiaSouth Eastern AsiaSouthern EuropeSpainSri LankaSt. Vincent and the GrenadinesSudanSwedenSwitzerlandSyriaTaiwanThailandTrinidad and TobagoTurkeyUgandaUkraineUruguayUzbekistanVenezuelaVietnamWest IndiesWestern AfricaWestern AsiaWestern EuropeYemenZaireZimbabweAzores
GED/Equivalency
Income
Poverty
Unemployment
Labor Participation
Family Structure
Vehicle Availability
Education Level
Disability

Immigrants from Lithuania GED/Equivalency
Exceptional

88.6%
GED/EQUIVALENCY
99.8/ 100
METRIC RATING
27th/ 347
METRIC RANK

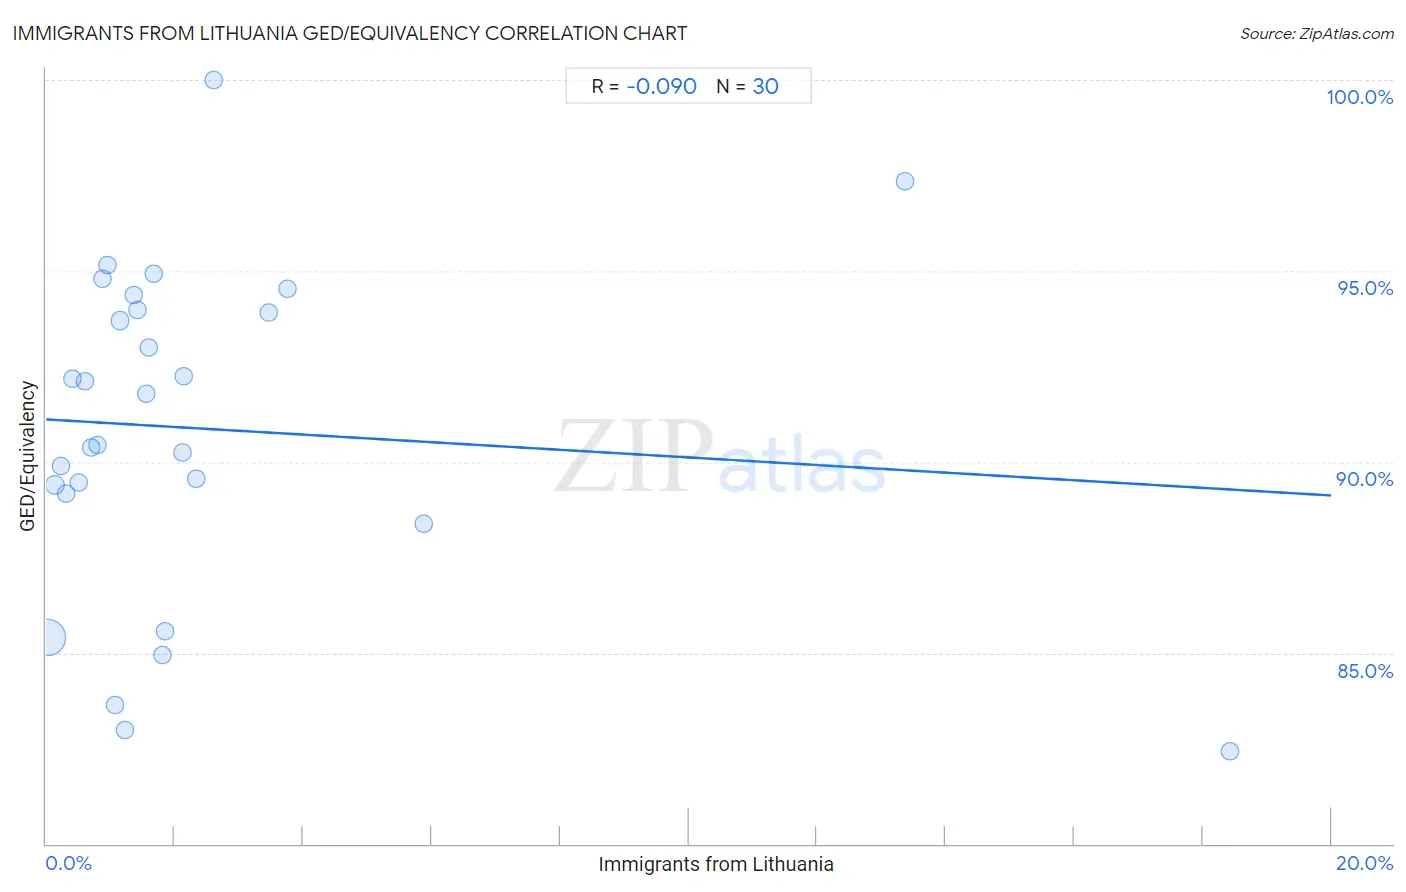
Immigrants from Lithuania GED/Equivalency Correlation Chart

The statistical analysis conducted on geographies consisting of 117,724,932 people shows a slight negative correlation between the proportion of Immigrants from Lithuania and percentage of population with at least ged/equivalency education in the United States with a correlation coefficient (R) of -0.090 and weighted average of 88.6%. On average, for every 1% (one percent) increase in Immigrants from Lithuania within a typical geography, there is a decrease of 0.100% in percentage of population with at least ged/equivalency education.
Immigrants from Lithuania GED/Equivalency
It is essential to understand that the correlation between the percentage of Immigrants from Lithuania and percentage of population with at least ged/equivalency education does not imply a direct cause-and-effect relationship. It remains uncertain whether the presence of Immigrants from Lithuania influences an upward or downward trend in the level of percentage of population with at least ged/equivalency education within an area, or if Immigrants from Lithuania simply ended up residing in those areas with higher or lower levels of percentage of population with at least ged/equivalency education due to other factors.

Demographics Similar to Immigrants from Lithuania by GED/Equivalency

In terms of ged/equivalency, the demographic groups most similar to Immigrants from Lithuania are Immigrants from Australia (88.6%, a difference of 0.030%), Russian (88.6%, a difference of 0.040%), Slovak (88.6%, a difference of 0.040%), Estonian (88.6%, a difference of 0.040%), and Immigrants from Northern Europe (88.5%, a difference of 0.040%).
DemographicsRating | RankGED/Equivalency
Maltese
99.9
/100
|
#20
Exceptional
88.6%
Luxembourgers
99.8
/100
|
#21
Exceptional
88.6%
Immigrants from Ireland
99.8
/100
|
#22
Exceptional
88.6%
Russians
99.8
/100
|
#23
Exceptional
88.6%
Slovaks
99.8
/100
|
#24
Exceptional
88.6%
Estonians
99.8
/100
|
#25
Exceptional
88.6%
Immigrants from Australia
99.8
/100
|
#26
Exceptional
88.6%
Immigrants from Lithuania
99.8
/100
|
#27
Exceptional
88.6%
Immigrants from Northern Europe
99.8
/100
|
#28
Exceptional
88.5%
Poles
99.8
/100
|
#29
Exceptional
88.5%
Turks
99.8
/100
|
#30
Exceptional
88.5%
Bhutanese
99.8
/100
|
#31
Exceptional
88.4%
Danes
99.8
/100
|
#32
Exceptional
88.4%
Immigrants from Sweden
99.7
/100
|
#33
Exceptional
88.4%
Immigrants from Japan
99.7
/100
|
#34
Exceptional
88.4%

Immigrants from Lithuania GED/Equivalency Correlation Summary

MeasurementImmigrants from Lithuania DataGED/Equivalency Data
Minimum0.022%82.4%
Maximum18.4%100.0%
Range18.4%17.6%
Mean2.5%90.9%
Median1.4%91.1%
Interquartile 25% (IQ1)0.69%89.2%
Interquartile 75% (IQ3)2.1%94.0%
Interquartile Range (IQR)1.5%4.8%
Standard Deviation (Sample)3.9%4.3%
Standard Deviation (Population)3.8%4.2%

Correlation Details

Immigrants from Lithuania PercentileSample SizeGED/Equivalency
[
0.0%
-
0.5%
]
0.022%
102,995,48885.4%
[
0.0%
-
0.5%
]
0.13%
8,126,95789.4%
[
0.0%
-
0.5%
]
0.23%
3,211,70889.9%
[
0.0%
-
0.5%
]
0.31%
1,266,92789.2%
[
0.0%
-
0.5%
]
0.41%
561,60892.2%
[
0.0%
-
0.5%
]
0.50%
361,53989.5%
[
0.5%
-
1.0%
]
0.61%
271,35192.1%
[
0.5%
-
1.0%
]
0.69%
192,84190.4%
[
0.5%
-
1.0%
]
0.80%
72,01790.4%
[
0.5%
-
1.0%
]
0.87%
134,52494.8%
[
0.5%
-
1.0%
]
0.96%
19,74195.2%
[
1.0%
-
1.5%
]
1.06%
58,90483.6%
[
1.0%
-
1.5%
]
1.14%
122,77593.7%
[
1.0%
-
1.5%
]
1.22%
6,74383.0%
[
1.0%
-
1.5%
]
1.36%
38,57294.4%
[
1.0%
-
1.5%
]
1.43%
55,35394.0%
[
1.5%
-
2.0%
]
1.55%
28,06191.8%
[
1.5%
-
2.0%
]
1.59%
44,40693.0%
[
1.5%
-
2.0%
]
1.67%
12,77894.9%
[
1.5%
-
2.0%
]
1.82%
16,83384.9%
[
1.5%
-
2.0%
]
1.85%
51,20685.6%
[
2.0%
-
2.5%
]
2.12%
5,86290.2%
[
2.0%
-
2.5%
]
2.14%
10,44392.2%
[
2.0%
-
2.5%
]
2.33%
10,26889.6%
[
2.5%
-
3.0%
]
2.60%
1,536100.0%
[
3.0%
-
3.5%
]
3.47%
26,81093.9%
[
3.5%
-
4.0%
]
3.76%
18,53394.5%
[
5.5%
-
6.0%
]
5.88%
18788.4%
[
13.0%
-
13.5%
]
13.36%
49497.4%
[
18.0%
-
18.5%
]
18.42%
46782.4%