Immigrants from Kuwait Married-Couple Family Poverty

COMPARE

Immigrants from Kuwait
Race
Ancestry
AfghanAfricanAlaska NativeAlaskan AthabascanAlbanianAleutAlsatianAmericanApacheArabArapahoArgentineanArmenianAssyrian/Chaldean/SyriacAustralianAustrianBahamianBangladeshiBarbadianBasqueBelgianBelizeanBermudanBhutaneseBlackfeetBolivianBrazilianBritishBritish West IndianBulgarianBurmeseCajunCambodianCanadianCape VerdeanCarpatho RusynCelticCentral AmericanCentral American IndianCherokeeCheyenneChickasawChileanChineseChippewaChoctawColombianColvilleComancheCosta RicanCreeCreekCroatianCrowCubanCypriotCzechCzechoslovakianDanishDelawareDominicanDutchDutch West IndianEastern EuropeanEcuadorianEgyptianEnglishEstonianEthiopianEuropeanFijianFilipinoFinnishFrenchFrench American IndianFrench CanadianGermanGerman RussianGhanaianGreekGuamanian/ChamorroGuatemalanGuyaneseHaitianHmongHonduranHopiHoumaHungarianIcelanderIndian (Asian)IndonesianInupiatIranianIraqiIrishIroquoisIsraeliItalianJamaicanJapaneseJordanianKenyanKiowaKoreanLaotianLatvianLebaneseLiberianLithuanianLumbeeLuxembourgerMacedonianMalaysianMalteseMarshalleseMenomineeMexicanMexican American IndianMongolianMoroccanNative HawaiianNavajoNepaleseNew ZealanderNicaraguanNigerianNorthern EuropeanNorwegianOkinawanOsageOttawaPaiutePakistaniPalestinianPanamanianParaguayanPennsylvania GermanPeruvianPimaPolishPortuguesePotawatomiPuebloPuerto RicanPuget Sound SalishRomanianRussianSalvadoranSamoanScandinavianScotch-IrishScottishSeminoleSenegaleseSerbianShoshoneSierra LeoneanSiouxSlavicSlovakSloveneSomaliSouth AfricanSouth AmericanSouth American IndianSoviet UnionSpaniardSpanishSpanish AmericanSpanish American IndianSri LankanSubsaharan AfricanSudaneseSwedishSwissSyrianTaiwaneseThaiTlingit-HaidaTohono O'OdhamTonganTrinidadian and TobagonianTsimshianTurkishU.S. Virgin IslanderUgandanUkrainianUruguayanUteVenezuelanVietnameseWelshWest IndianYakamaYaquiYugoslavianYumanYup'ikZimbabwean
Immigration
NonimmigrantsImmigrantsAfghanistanAfricaAlbaniaArgentinaArmeniaAsiaAustraliaAustriaBahamasBangladeshBarbadosBelarusBelgiumBelizeBoliviaBosnia and HerzegovinaBrazilBulgariaBurma/MyanmarCabo VerdeCambodiaCameroonCanadaCaribbeanCentral AmericaChileChinaColombiaCongoCosta RicaCroatiaCubaCzechoslovakiaDenmarkDominicaDominican RepublicEastern AfricaEastern AsiaEastern EuropeEcuadorEgyptEl SalvadorEnglandEritreaEthiopiaEuropeFijiFranceGermanyGhanaGreeceGrenadaGuatemalaGuyanaHaitiHondurasHong KongHungaryIndiaIndonesiaIranIraqIrelandIsraelItalyJamaicaJapanJordanKazakhstanKenyaKoreaKuwaitLaosLatin AmericaLatviaLebanonLiberiaLithuaniaMalaysiaMexicoMicronesiaMiddle AfricaMoldovaMoroccoNepalNetherlandsNicaraguaNigeriaNorth AmericaNorth MacedoniaNorthern AfricaNorthern EuropeNorwayOceaniaPakistanPanamaPeruPhilippinesPolandPortugalRomaniaRussiaSaudi ArabiaScotlandSenegalSerbiaSierra LeoneSingaporeSomaliaSouth AfricaSouth AmericaSouth Central AsiaSouth Eastern AsiaSouthern EuropeSpainSri LankaSt. Vincent and the GrenadinesSudanSwedenSwitzerlandSyriaTaiwanThailandTrinidad and TobagoTurkeyUgandaUkraineUruguayUzbekistanVenezuelaVietnamWest IndiesWestern AfricaWestern AsiaWestern EuropeYemenZaireZimbabweAzores
Select to Compare
Race
Ancestry
AfghanAfricanAlaska NativeAlaskan AthabascanAlbanianAleutAlsatianAmericanApacheArabArapahoArgentineanArmenianAssyrian/Chaldean/SyriacAustralianAustrianBahamianBangladeshiBarbadianBasqueBelgianBelizeanBermudanBhutaneseBlackfeetBolivianBrazilianBritishBritish West IndianBulgarianBurmeseCajunCambodianCanadianCape VerdeanCarpatho RusynCelticCentral AmericanCentral American IndianCherokeeCheyenneChickasawChileanChineseChippewaChoctawColombianColvilleComancheCosta RicanCreeCreekCroatianCrowCubanCypriotCzechCzechoslovakianDanishDelawareDominicanDutchDutch West IndianEastern EuropeanEcuadorianEgyptianEnglishEstonianEthiopianEuropeanFijianFilipinoFinnishFrenchFrench American IndianFrench CanadianGermanGerman RussianGhanaianGreekGuamanian/ChamorroGuatemalanGuyaneseHaitianHmongHonduranHopiHoumaHungarianIcelanderIndian (Asian)IndonesianInupiatIranianIraqiIrishIroquoisIsraeliItalianJamaicanJapaneseJordanianKenyanKiowaKoreanLaotianLatvianLebaneseLiberianLithuanianLumbeeLuxembourgerMacedonianMalaysianMalteseMarshalleseMenomineeMexicanMexican American IndianMongolianMoroccanNative HawaiianNavajoNepaleseNew ZealanderNicaraguanNigerianNorthern EuropeanNorwegianOkinawanOsageOttawaPaiutePakistaniPalestinianPanamanianParaguayanPennsylvania GermanPeruvianPimaPolishPortuguesePotawatomiPuebloPuerto RicanPuget Sound SalishRomanianRussianSalvadoranSamoanScandinavianScotch-IrishScottishSeminoleSenegaleseSerbianShoshoneSierra LeoneanSiouxSlavicSlovakSloveneSomaliSouth AfricanSouth AmericanSouth American IndianSoviet UnionSpaniardSpanishSpanish AmericanSpanish American IndianSri LankanSubsaharan AfricanSudaneseSwedishSwissSyrianTaiwaneseThaiTlingit-HaidaTohono O'OdhamTonganTrinidadian and TobagonianTsimshianTurkishU.S. Virgin IslanderUgandanUkrainianUruguayanUteVenezuelanVietnameseWelshWest IndianYakamaYaquiYugoslavianYumanYup'ikZimbabwean
Immigration
NonimmigrantsImmigrantsAfghanistanAfricaAlbaniaArgentinaArmeniaAsiaAustraliaAustriaBahamasBangladeshBarbadosBelarusBelgiumBelizeBoliviaBosnia and HerzegovinaBrazilBulgariaBurma/MyanmarCabo VerdeCambodiaCameroonCanadaCaribbeanCentral AmericaChileChinaColombiaCongoCosta RicaCroatiaCubaCzechoslovakiaDenmarkDominicaDominican RepublicEastern AfricaEastern AsiaEastern EuropeEcuadorEgyptEl SalvadorEnglandEritreaEthiopiaEuropeFijiFranceGermanyGhanaGreeceGrenadaGuatemalaGuyanaHaitiHondurasHong KongHungaryIndiaIndonesiaIranIraqIrelandIsraelItalyJamaicaJapanJordanKazakhstanKenyaKoreaLaosLatin AmericaLatviaLebanonLiberiaLithuaniaMalaysiaMexicoMicronesiaMiddle AfricaMoldovaMoroccoNepalNetherlandsNicaraguaNigeriaNorth AmericaNorth MacedoniaNorthern AfricaNorthern EuropeNorwayOceaniaPakistanPanamaPeruPhilippinesPolandPortugalRomaniaRussiaSaudi ArabiaScotlandSenegalSerbiaSierra LeoneSingaporeSomaliaSouth AfricaSouth AmericaSouth Central AsiaSouth Eastern AsiaSouthern EuropeSpainSri LankaSt. Vincent and the GrenadinesSudanSwedenSwitzerlandSyriaTaiwanThailandTrinidad and TobagoTurkeyUgandaUkraineUruguayUzbekistanVenezuelaVietnamWest IndiesWestern AfricaWestern AsiaWestern EuropeYemenZaireZimbabweAzores
Married-Couple Family Poverty
Income
Poverty
Unemployment
Labor Participation
Family Structure
Vehicle Availability
Education Level
Disability

Immigrants from Kuwait Married-Couple Family Poverty
Good

5.0%
POVERTY | MARRIED-COUPLE FAMILIES
76.3/ 100
METRIC RATING
153rd/ 347
METRIC RANK

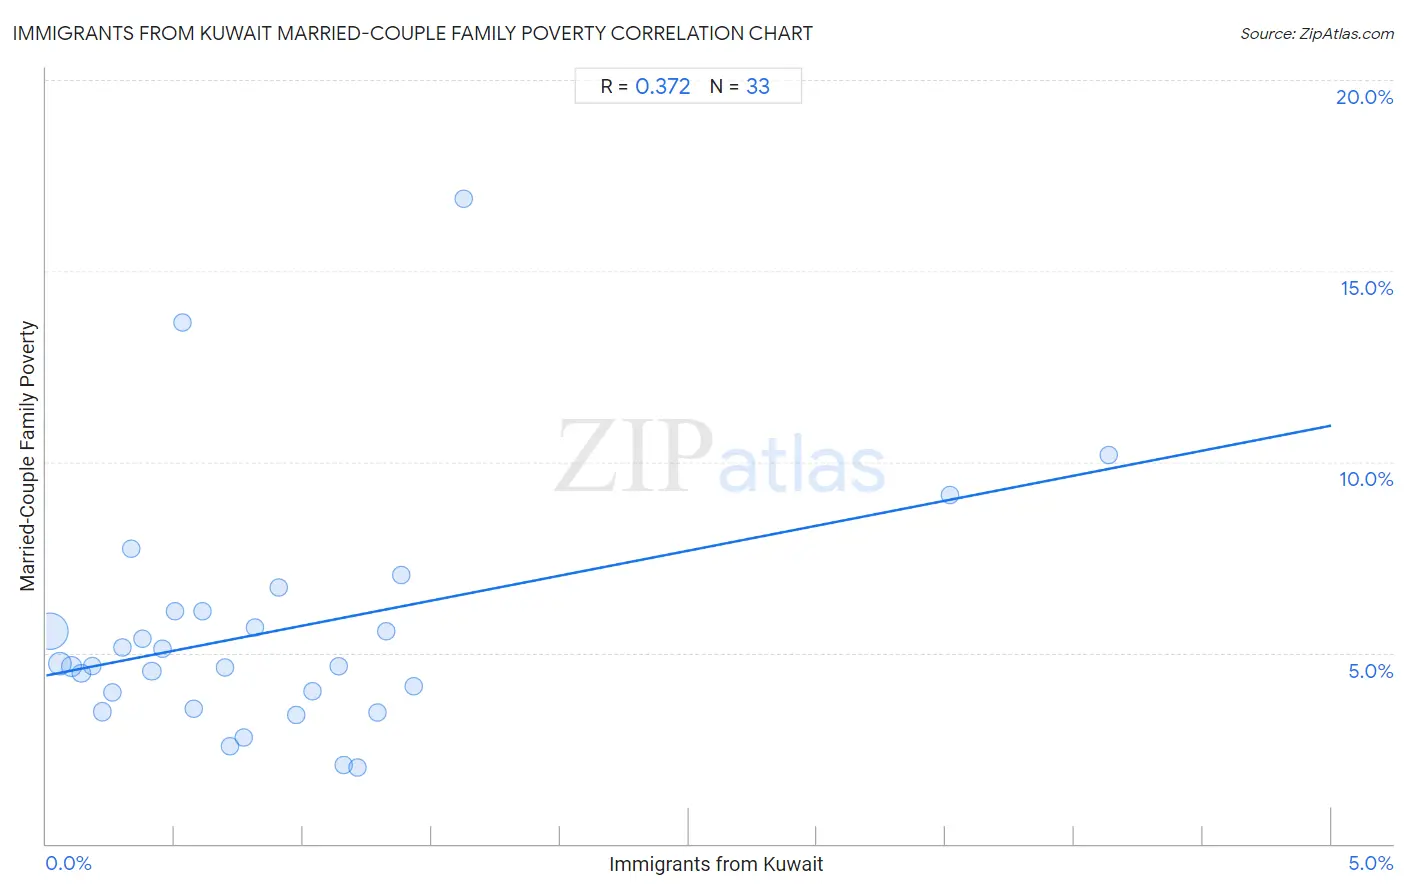
Immigrants from Kuwait Married-Couple Family Poverty Correlation Chart

The statistical analysis conducted on geographies consisting of 136,568,646 people shows a mild positive correlation between the proportion of Immigrants from Kuwait and poverty level among married-couple families in the United States with a correlation coefficient (R) of 0.372 and weighted average of 5.0%. On average, for every 1% (one percent) increase in Immigrants from Kuwait within a typical geography, there is an increase of 1.3% in poverty level among married-couple families.
Immigrants from Kuwait Married-Couple Family Poverty
It is essential to understand that the correlation between the percentage of Immigrants from Kuwait and poverty level among married-couple families does not imply a direct cause-and-effect relationship. It remains uncertain whether the presence of Immigrants from Kuwait influences an upward or downward trend in the level of poverty level among married-couple families within an area, or if Immigrants from Kuwait simply ended up residing in those areas with higher or lower levels of poverty level among married-couple families due to other factors.

Demographics Similar to Immigrants from Kuwait by Married-Couple Family Poverty

In terms of married-couple family poverty, the demographic groups most similar to Immigrants from Kuwait are Albanian (5.0%, a difference of 0.15%), Immigrants from Cameroon (5.0%, a difference of 0.16%), Brazilian (5.0%, a difference of 0.33%), Immigrants from Oceania (5.0%, a difference of 0.38%), and Syrian (5.0%, a difference of 0.41%).
DemographicsRating | RankMarried-Couple Family Poverty
Mongolians
79.8
/100
|
#146
Good
5.0%
Syrians
78.7
/100
|
#147
Good
5.0%
Immigrants from Russia
78.7
/100
|
#148
Good
5.0%
Immigrants from Oceania
78.6
/100
|
#149
Good
5.0%
Brazilians
78.3
/100
|
#150
Good
5.0%
Immigrants from Cameroon
77.3
/100
|
#151
Good
5.0%
Albanians
77.2
/100
|
#152
Good
5.0%
Immigrants from Kuwait
76.3
/100
|
#153
Good
5.0%
Delaware
73.7
/100
|
#154
Good
5.1%
Immigrants from Ethiopia
72.4
/100
|
#155
Good
5.1%
Sri Lankans
72.2
/100
|
#156
Good
5.1%
Argentineans
70.7
/100
|
#157
Good
5.1%
Immigrants from South Eastern Asia
70.4
/100
|
#158
Good
5.1%
Immigrants from Saudi Arabia
70.3
/100
|
#159
Good
5.1%
Pennsylvania Germans
68.5
/100
|
#160
Good
5.1%

Immigrants from Kuwait Married-Couple Family Poverty Correlation Summary

MeasurementImmigrants from Kuwait DataMarried-Couple Family Poverty Data
Minimum0.016%2.0%
Maximum4.1%16.9%
Range4.1%14.9%
Mean0.88%5.6%
Median0.70%4.7%
Interquartile 25% (IQ1)0.31%3.8%
Interquartile 75% (IQ3)1.2%6.1%
Interquartile Range (IQR)0.87%2.3%
Standard Deviation (Sample)0.88%3.1%
Standard Deviation (Population)0.87%3.1%

Correlation Details

Immigrants from Kuwait PercentileSample SizeMarried-Couple Family Poverty
[
0.0%
-
0.5%
]
0.016%
90,377,9225.6%
[
0.0%
-
0.5%
]
0.055%
24,959,0244.7%
[
0.0%
-
0.5%
]
0.098%
9,211,9654.6%
[
0.0%
-
0.5%
]
0.14%
4,640,2254.5%
[
0.0%
-
0.5%
]
0.18%
2,134,7464.7%
[
0.0%
-
0.5%
]
0.22%
1,584,8943.5%
[
0.0%
-
0.5%
]
0.26%
915,1194.0%
[
0.0%
-
0.5%
]
0.30%
628,3595.1%
[
0.0%
-
0.5%
]
0.33%
395,7707.7%
[
0.0%
-
0.5%
]
0.37%
344,8665.4%
[
0.0%
-
0.5%
]
0.41%
450,5914.5%
[
0.0%
-
0.5%
]
0.45%
167,6425.1%
[
0.5%
-
1.0%
]
0.50%
132,5716.1%
[
0.5%
-
1.0%
]
0.53%
135,59513.6%
[
0.5%
-
1.0%
]
0.57%
65,6323.5%
[
0.5%
-
1.0%
]
0.61%
38,8916.1%
[
0.5%
-
1.0%
]
0.70%
47,5504.6%
[
0.5%
-
1.0%
]
0.72%
36,2432.5%
[
0.5%
-
1.0%
]
0.77%
14,7142.8%
[
0.5%
-
1.0%
]
0.81%
37,5835.7%
[
0.5%
-
1.0%
]
0.90%
25,1306.7%
[
0.5%
-
1.0%
]
0.97%
41,2893.4%
[
1.0%
-
1.5%
]
1.04%
7,7224.0%
[
1.0%
-
1.5%
]
1.14%
30,2204.7%
[
1.0%
-
1.5%
]
1.16%
2,3372.1%
[
1.0%
-
1.5%
]
1.21%
21,3422.0%
[
1.0%
-
1.5%
]
1.29%
3,4193.4%
[
1.0%
-
1.5%
]
1.32%
46,4735.6%
[
1.0%
-
1.5%
]
1.38%
5,2057.0%
[
1.0%
-
1.5%
]
1.43%
34,1484.1%
[
1.5%
-
2.0%
]
1.62%
26,70816.9%
[
3.5%
-
4.0%
]
3.52%
2,3329.1%
[
4.0%
-
4.5%
]
4.13%
2,41910.2%