Immigrants from Kuwait GED/Equivalency

COMPARE

Immigrants from Kuwait
Race
Ancestry
AfghanAfricanAlaska NativeAlaskan AthabascanAlbanianAleutAlsatianAmericanApacheArabArapahoArgentineanArmenianAssyrian/Chaldean/SyriacAustralianAustrianBahamianBangladeshiBarbadianBasqueBelgianBelizeanBermudanBhutaneseBlackfeetBolivianBrazilianBritishBritish West IndianBulgarianBurmeseCajunCambodianCanadianCape VerdeanCarpatho RusynCelticCentral AmericanCentral American IndianCherokeeCheyenneChickasawChileanChineseChippewaChoctawColombianColvilleComancheCosta RicanCreeCreekCroatianCrowCubanCypriotCzechCzechoslovakianDanishDelawareDominicanDutchDutch West IndianEastern EuropeanEcuadorianEgyptianEnglishEstonianEthiopianEuropeanFijianFilipinoFinnishFrenchFrench American IndianFrench CanadianGermanGerman RussianGhanaianGreekGuamanian/ChamorroGuatemalanGuyaneseHaitianHmongHonduranHopiHoumaHungarianIcelanderIndian (Asian)IndonesianInupiatIranianIraqiIrishIroquoisIsraeliItalianJamaicanJapaneseJordanianKenyanKiowaKoreanLaotianLatvianLebaneseLiberianLithuanianLumbeeLuxembourgerMacedonianMalaysianMalteseMarshalleseMenomineeMexicanMexican American IndianMongolianMoroccanNative HawaiianNavajoNepaleseNew ZealanderNicaraguanNigerianNorthern EuropeanNorwegianOkinawanOsageOttawaPaiutePakistaniPalestinianPanamanianParaguayanPennsylvania GermanPeruvianPimaPolishPortuguesePotawatomiPuebloPuerto RicanPuget Sound SalishRomanianRussianSalvadoranSamoanScandinavianScotch-IrishScottishSeminoleSenegaleseSerbianShoshoneSierra LeoneanSiouxSlavicSlovakSloveneSomaliSouth AfricanSouth AmericanSouth American IndianSoviet UnionSpaniardSpanishSpanish AmericanSpanish American IndianSri LankanSubsaharan AfricanSudaneseSwedishSwissSyrianTaiwaneseThaiTlingit-HaidaTohono O'OdhamTonganTrinidadian and TobagonianTsimshianTurkishU.S. Virgin IslanderUgandanUkrainianUruguayanUteVenezuelanVietnameseWelshWest IndianYakamaYaquiYugoslavianYumanYup'ikZimbabwean
Immigration
NonimmigrantsImmigrantsAfghanistanAfricaAlbaniaArgentinaArmeniaAsiaAustraliaAustriaBahamasBangladeshBarbadosBelarusBelgiumBelizeBoliviaBosnia and HerzegovinaBrazilBulgariaBurma/MyanmarCabo VerdeCambodiaCameroonCanadaCaribbeanCentral AmericaChileChinaColombiaCongoCosta RicaCroatiaCubaCzechoslovakiaDenmarkDominicaDominican RepublicEastern AfricaEastern AsiaEastern EuropeEcuadorEgyptEl SalvadorEnglandEritreaEthiopiaEuropeFijiFranceGermanyGhanaGreeceGrenadaGuatemalaGuyanaHaitiHondurasHong KongHungaryIndiaIndonesiaIranIraqIrelandIsraelItalyJamaicaJapanJordanKazakhstanKenyaKoreaKuwaitLaosLatin AmericaLatviaLebanonLiberiaLithuaniaMalaysiaMexicoMicronesiaMiddle AfricaMoldovaMoroccoNepalNetherlandsNicaraguaNigeriaNorth AmericaNorth MacedoniaNorthern AfricaNorthern EuropeNorwayOceaniaPakistanPanamaPeruPhilippinesPolandPortugalRomaniaRussiaSaudi ArabiaScotlandSenegalSerbiaSierra LeoneSingaporeSomaliaSouth AfricaSouth AmericaSouth Central AsiaSouth Eastern AsiaSouthern EuropeSpainSri LankaSt. Vincent and the GrenadinesSudanSwedenSwitzerlandSyriaTaiwanThailandTrinidad and TobagoTurkeyUgandaUkraineUruguayUzbekistanVenezuelaVietnamWest IndiesWestern AfricaWestern AsiaWestern EuropeYemenZaireZimbabweAzores
Select to Compare
Race
Ancestry
AfghanAfricanAlaska NativeAlaskan AthabascanAlbanianAleutAlsatianAmericanApacheArabArapahoArgentineanArmenianAssyrian/Chaldean/SyriacAustralianAustrianBahamianBangladeshiBarbadianBasqueBelgianBelizeanBermudanBhutaneseBlackfeetBolivianBrazilianBritishBritish West IndianBulgarianBurmeseCajunCambodianCanadianCape VerdeanCarpatho RusynCelticCentral AmericanCentral American IndianCherokeeCheyenneChickasawChileanChineseChippewaChoctawColombianColvilleComancheCosta RicanCreeCreekCroatianCrowCubanCypriotCzechCzechoslovakianDanishDelawareDominicanDutchDutch West IndianEastern EuropeanEcuadorianEgyptianEnglishEstonianEthiopianEuropeanFijianFilipinoFinnishFrenchFrench American IndianFrench CanadianGermanGerman RussianGhanaianGreekGuamanian/ChamorroGuatemalanGuyaneseHaitianHmongHonduranHopiHoumaHungarianIcelanderIndian (Asian)IndonesianInupiatIranianIraqiIrishIroquoisIsraeliItalianJamaicanJapaneseJordanianKenyanKiowaKoreanLaotianLatvianLebaneseLiberianLithuanianLumbeeLuxembourgerMacedonianMalaysianMalteseMarshalleseMenomineeMexicanMexican American IndianMongolianMoroccanNative HawaiianNavajoNepaleseNew ZealanderNicaraguanNigerianNorthern EuropeanNorwegianOkinawanOsageOttawaPaiutePakistaniPalestinianPanamanianParaguayanPennsylvania GermanPeruvianPimaPolishPortuguesePotawatomiPuebloPuerto RicanPuget Sound SalishRomanianRussianSalvadoranSamoanScandinavianScotch-IrishScottishSeminoleSenegaleseSerbianShoshoneSierra LeoneanSiouxSlavicSlovakSloveneSomaliSouth AfricanSouth AmericanSouth American IndianSoviet UnionSpaniardSpanishSpanish AmericanSpanish American IndianSri LankanSubsaharan AfricanSudaneseSwedishSwissSyrianTaiwaneseThaiTlingit-HaidaTohono O'OdhamTonganTrinidadian and TobagonianTsimshianTurkishU.S. Virgin IslanderUgandanUkrainianUruguayanUteVenezuelanVietnameseWelshWest IndianYakamaYaquiYugoslavianYumanYup'ikZimbabwean
Immigration
NonimmigrantsImmigrantsAfghanistanAfricaAlbaniaArgentinaArmeniaAsiaAustraliaAustriaBahamasBangladeshBarbadosBelarusBelgiumBelizeBoliviaBosnia and HerzegovinaBrazilBulgariaBurma/MyanmarCabo VerdeCambodiaCameroonCanadaCaribbeanCentral AmericaChileChinaColombiaCongoCosta RicaCroatiaCubaCzechoslovakiaDenmarkDominicaDominican RepublicEastern AfricaEastern AsiaEastern EuropeEcuadorEgyptEl SalvadorEnglandEritreaEthiopiaEuropeFijiFranceGermanyGhanaGreeceGrenadaGuatemalaGuyanaHaitiHondurasHong KongHungaryIndiaIndonesiaIranIraqIrelandIsraelItalyJamaicaJapanJordanKazakhstanKenyaKoreaLaosLatin AmericaLatviaLebanonLiberiaLithuaniaMalaysiaMexicoMicronesiaMiddle AfricaMoldovaMoroccoNepalNetherlandsNicaraguaNigeriaNorth AmericaNorth MacedoniaNorthern AfricaNorthern EuropeNorwayOceaniaPakistanPanamaPeruPhilippinesPolandPortugalRomaniaRussiaSaudi ArabiaScotlandSenegalSerbiaSierra LeoneSingaporeSomaliaSouth AfricaSouth AmericaSouth Central AsiaSouth Eastern AsiaSouthern EuropeSpainSri LankaSt. Vincent and the GrenadinesSudanSwedenSwitzerlandSyriaTaiwanThailandTrinidad and TobagoTurkeyUgandaUkraineUruguayUzbekistanVenezuelaVietnamWest IndiesWestern AfricaWestern AsiaWestern EuropeYemenZaireZimbabweAzores
GED/Equivalency
Income
Poverty
Unemployment
Labor Participation
Family Structure
Vehicle Availability
Education Level
Disability

Immigrants from Kuwait GED/Equivalency
Exceptional

87.7%
GED/EQUIVALENCY
98.8/ 100
METRIC RATING
74th/ 347
METRIC RANK

Immigrants from Kuwait GED/Equivalency Correlation Chart

The statistical analysis conducted on geographies consisting of 136,917,085 people shows a slight positive correlation between the proportion of Immigrants from Kuwait and percentage of population with at least ged/equivalency education in the United States with a correlation coefficient (R) of 0.098 and weighted average of 87.7%. On average, for every 1% (one percent) increase in Immigrants from Kuwait within a typical geography, there is an increase of 0.23% in percentage of population with at least ged/equivalency education.
Immigrants from Kuwait GED/Equivalency
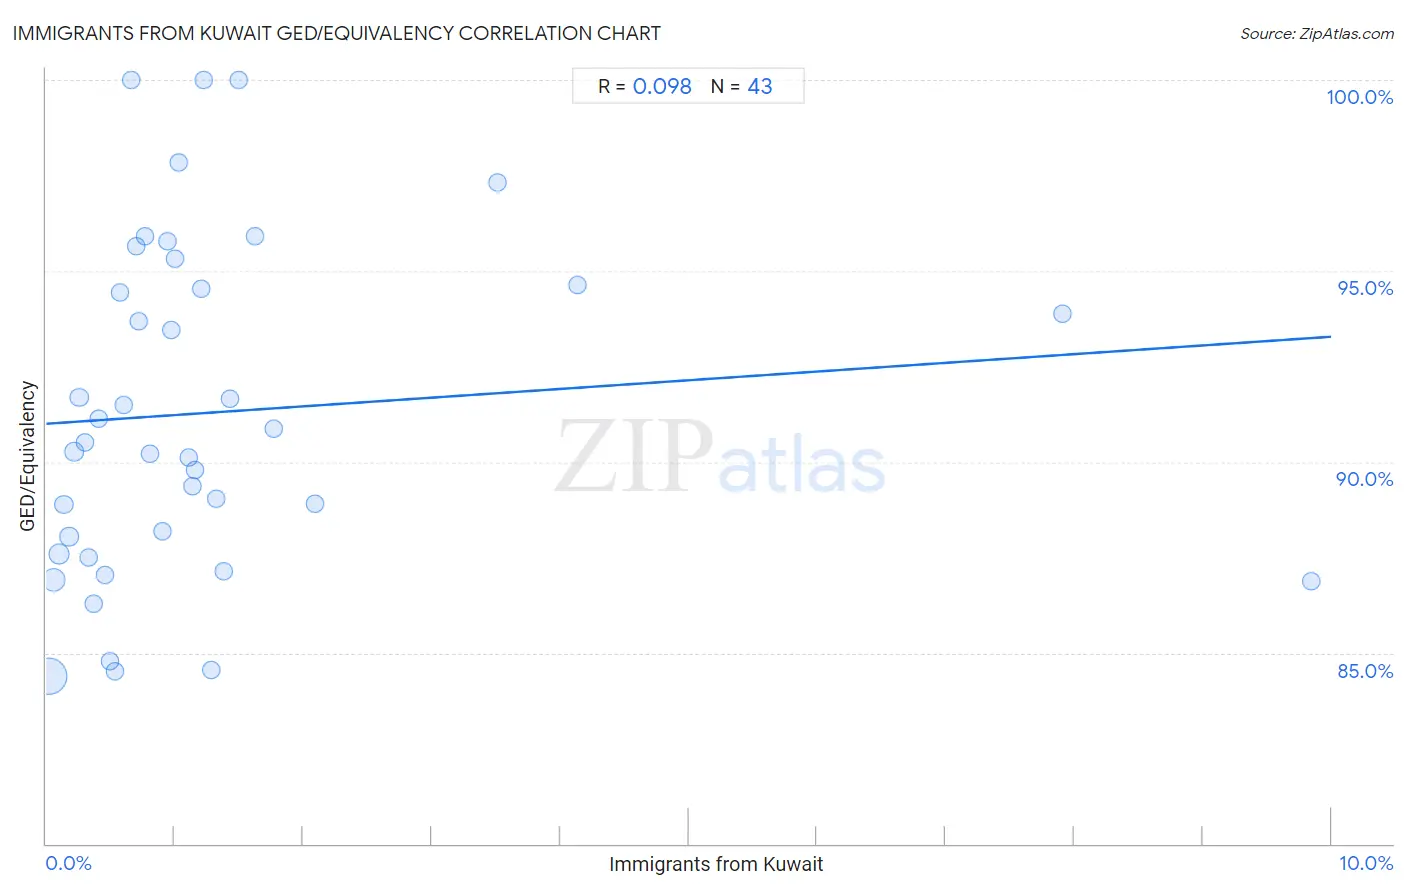
It is essential to understand that the correlation between the percentage of Immigrants from Kuwait and percentage of population with at least ged/equivalency education does not imply a direct cause-and-effect relationship. It remains uncertain whether the presence of Immigrants from Kuwait influences an upward or downward trend in the level of percentage of population with at least ged/equivalency education within an area, or if Immigrants from Kuwait simply ended up residing in those areas with higher or lower levels of percentage of population with at least ged/equivalency education due to other factors.

Demographics Similar to Immigrants from Kuwait by GED/Equivalency

In terms of ged/equivalency, the demographic groups most similar to Immigrants from Kuwait are Belgian (87.7%, a difference of 0.020%), Scottish (87.7%, a difference of 0.020%), Ukrainian (87.7%, a difference of 0.030%), Austrian (87.7%, a difference of 0.030%), and Immigrants from Moldova (87.7%, a difference of 0.030%).
DemographicsRating | RankGED/Equivalency
British
99.1
/100
|
#67
Exceptional
87.8%
Immigrants from France
99.1
/100
|
#68
Exceptional
87.8%
Immigrants from Saudi Arabia
99.0
/100
|
#69
Exceptional
87.8%
Ukrainians
98.8
/100
|
#70
Exceptional
87.7%
Austrians
98.8
/100
|
#71
Exceptional
87.7%
Immigrants from Moldova
98.8
/100
|
#72
Exceptional
87.7%
Belgians
98.8
/100
|
#73
Exceptional
87.7%
Immigrants from Kuwait
98.8
/100
|
#74
Exceptional
87.7%
Scottish
98.7
/100
|
#75
Exceptional
87.7%
Immigrants from Serbia
98.7
/100
|
#76
Exceptional
87.7%
Slavs
98.7
/100
|
#77
Exceptional
87.7%
Irish
98.6
/100
|
#78
Exceptional
87.6%
English
98.6
/100
|
#79
Exceptional
87.6%
Immigrants from England
98.5
/100
|
#80
Exceptional
87.6%
Immigrants from Sri Lanka
98.3
/100
|
#81
Exceptional
87.5%

Immigrants from Kuwait GED/Equivalency Correlation Summary

MeasurementImmigrants from Kuwait DataGED/Equivalency Data
Minimum0.016%84.4%
Maximum9.8%100.0%
Range9.8%15.6%
Mean1.3%91.3%
Median0.90%90.5%
Interquartile 25% (IQ1)0.41%87.6%
Interquartile 75% (IQ3)1.3%94.6%
Interquartile Range (IQR)0.91%7.0%
Standard Deviation (Sample)1.9%4.4%
Standard Deviation (Population)1.9%4.3%

Correlation Details

Immigrants from Kuwait PercentileSample SizeGED/Equivalency
[
0.0%
-
0.5%
]
0.016%
90,423,17184.4%
[
0.0%
-
0.5%
]
0.055%
25,048,98386.9%
[
0.0%
-
0.5%
]
0.098%
9,270,68087.6%
[
0.0%
-
0.5%
]
0.14%
4,653,47388.9%
[
0.0%
-
0.5%
]
0.18%
2,151,83088.0%
[
0.0%
-
0.5%
]
0.22%
1,590,43490.3%
[
0.0%
-
0.5%
]
0.26%
961,59791.7%
[
0.0%
-
0.5%
]
0.30%
634,98490.5%
[
0.0%
-
0.5%
]
0.33%
395,77087.5%
[
0.0%
-
0.5%
]
0.37%
344,86686.3%
[
0.0%
-
0.5%
]
0.41%
450,59191.1%
[
0.0%
-
0.5%
]
0.45%
176,78287.0%
[
0.5%
-
1.0%
]
0.50%
132,57184.8%
[
0.5%
-
1.0%
]
0.53%
141,22284.5%
[
0.5%
-
1.0%
]
0.57%
65,63294.4%
[
0.5%
-
1.0%
]
0.61%
42,36491.5%
[
0.5%
-
1.0%
]
0.66%
455100.0%
[
0.5%
-
1.0%
]
0.70%
48,27395.7%
[
0.5%
-
1.0%
]
0.72%
36,24393.7%
[
0.5%
-
1.0%
]
0.77%
21,79895.9%
[
0.5%
-
1.0%
]
0.81%
37,58390.2%
[
0.5%
-
1.0%
]
0.90%
25,13088.2%
[
0.5%
-
1.0%
]
0.94%
11,26595.8%
[
0.5%
-
1.0%
]
0.97%
43,06893.5%
[
1.0%
-
1.5%
]
1.01%
13,31595.3%
[
1.0%
-
1.5%
]
1.04%
8,40397.8%
[
1.0%
-
1.5%
]
1.11%
1,35790.1%
[
1.0%
-
1.5%
]
1.14%
30,22089.4%
[
1.0%
-
1.5%
]
1.16%
3,20089.8%
[
1.0%
-
1.5%
]
1.21%
21,34294.5%
[
1.0%
-
1.5%
]
1.23%
4,478100.0%
[
1.0%
-
1.5%
]
1.29%
3,41984.6%
[
1.0%
-
1.5%
]
1.32%
46,47389.0%
[
1.0%
-
1.5%
]
1.38%
5,20587.1%
[
1.0%
-
1.5%
]
1.43%
34,14891.6%
[
1.0%
-
1.5%
]
1.50%
1,669100.0%
[
1.5%
-
2.0%
]
1.62%
26,70895.9%
[
1.5%
-
2.0%
]
1.77%
1,46790.9%
[
2.0%
-
2.5%
]
2.09%
1,24488.9%
[
3.5%
-
4.0%
]
3.52%
2,33297.3%
[
4.0%
-
4.5%
]
4.13%
2,41994.6%
[
7.5%
-
8.0%
]
7.90%
29193.9%
[
9.5%
-
10.0%
]
9.84%
63086.9%