Immigrants from Kuwait Self-Care Disability

COMPARE

Immigrants from Kuwait
Race
Ancestry
AfghanAfricanAlaska NativeAlaskan AthabascanAlbanianAleutAlsatianAmericanApacheArabArapahoArgentineanArmenianAssyrian/Chaldean/SyriacAustralianAustrianBahamianBangladeshiBarbadianBasqueBelgianBelizeanBermudanBhutaneseBlackfeetBolivianBrazilianBritishBritish West IndianBulgarianBurmeseCajunCambodianCanadianCape VerdeanCarpatho RusynCelticCentral AmericanCentral American IndianCherokeeCheyenneChickasawChileanChineseChippewaChoctawColombianColvilleComancheCosta RicanCreeCreekCroatianCrowCubanCypriotCzechCzechoslovakianDanishDelawareDominicanDutchDutch West IndianEastern EuropeanEcuadorianEgyptianEnglishEstonianEthiopianEuropeanFijianFilipinoFinnishFrenchFrench American IndianFrench CanadianGermanGerman RussianGhanaianGreekGuamanian/ChamorroGuatemalanGuyaneseHaitianHmongHonduranHopiHoumaHungarianIcelanderIndian (Asian)IndonesianInupiatIranianIraqiIrishIroquoisIsraeliItalianJamaicanJapaneseJordanianKenyanKiowaKoreanLaotianLatvianLebaneseLiberianLithuanianLumbeeLuxembourgerMacedonianMalaysianMalteseMarshalleseMenomineeMexicanMexican American IndianMongolianMoroccanNative HawaiianNavajoNepaleseNew ZealanderNicaraguanNigerianNorthern EuropeanNorwegianOkinawanOsageOttawaPaiutePakistaniPalestinianPanamanianParaguayanPennsylvania GermanPeruvianPimaPolishPortuguesePotawatomiPuebloPuerto RicanPuget Sound SalishRomanianRussianSalvadoranSamoanScandinavianScotch-IrishScottishSeminoleSenegaleseSerbianShoshoneSierra LeoneanSiouxSlavicSlovakSloveneSomaliSouth AfricanSouth AmericanSouth American IndianSoviet UnionSpaniardSpanishSpanish AmericanSpanish American IndianSri LankanSubsaharan AfricanSudaneseSwedishSwissSyrianTaiwaneseThaiTlingit-HaidaTohono O'OdhamTonganTrinidadian and TobagonianTsimshianTurkishU.S. Virgin IslanderUgandanUkrainianUruguayanUteVenezuelanVietnameseWelshWest IndianYakamaYaquiYugoslavianYumanYup'ikZimbabwean
Immigration
NonimmigrantsImmigrantsAfghanistanAfricaAlbaniaArgentinaArmeniaAsiaAustraliaAustriaBahamasBangladeshBarbadosBelarusBelgiumBelizeBoliviaBosnia and HerzegovinaBrazilBulgariaBurma/MyanmarCabo VerdeCambodiaCameroonCanadaCaribbeanCentral AmericaChileChinaColombiaCongoCosta RicaCroatiaCubaCzechoslovakiaDenmarkDominicaDominican RepublicEastern AfricaEastern AsiaEastern EuropeEcuadorEgyptEl SalvadorEnglandEritreaEthiopiaEuropeFijiFranceGermanyGhanaGreeceGrenadaGuatemalaGuyanaHaitiHondurasHong KongHungaryIndiaIndonesiaIranIraqIrelandIsraelItalyJamaicaJapanJordanKazakhstanKenyaKoreaKuwaitLaosLatin AmericaLatviaLebanonLiberiaLithuaniaMalaysiaMexicoMicronesiaMiddle AfricaMoldovaMoroccoNepalNetherlandsNicaraguaNigeriaNorth AmericaNorth MacedoniaNorthern AfricaNorthern EuropeNorwayOceaniaPakistanPanamaPeruPhilippinesPolandPortugalRomaniaRussiaSaudi ArabiaScotlandSenegalSerbiaSierra LeoneSingaporeSomaliaSouth AfricaSouth AmericaSouth Central AsiaSouth Eastern AsiaSouthern EuropeSpainSri LankaSt. Vincent and the GrenadinesSudanSwedenSwitzerlandSyriaTaiwanThailandTrinidad and TobagoTurkeyUgandaUkraineUruguayUzbekistanVenezuelaVietnamWest IndiesWestern AfricaWestern AsiaWestern EuropeYemenZaireZimbabweAzores
Select to Compare
Race
Ancestry
AfghanAfricanAlaska NativeAlaskan AthabascanAlbanianAleutAlsatianAmericanApacheArabArapahoArgentineanArmenianAssyrian/Chaldean/SyriacAustralianAustrianBahamianBangladeshiBarbadianBasqueBelgianBelizeanBermudanBhutaneseBlackfeetBolivianBrazilianBritishBritish West IndianBulgarianBurmeseCajunCambodianCanadianCape VerdeanCarpatho RusynCelticCentral AmericanCentral American IndianCherokeeCheyenneChickasawChileanChineseChippewaChoctawColombianColvilleComancheCosta RicanCreeCreekCroatianCrowCubanCypriotCzechCzechoslovakianDanishDelawareDominicanDutchDutch West IndianEastern EuropeanEcuadorianEgyptianEnglishEstonianEthiopianEuropeanFijianFilipinoFinnishFrenchFrench American IndianFrench CanadianGermanGerman RussianGhanaianGreekGuamanian/ChamorroGuatemalanGuyaneseHaitianHmongHonduranHopiHoumaHungarianIcelanderIndian (Asian)IndonesianInupiatIranianIraqiIrishIroquoisIsraeliItalianJamaicanJapaneseJordanianKenyanKiowaKoreanLaotianLatvianLebaneseLiberianLithuanianLumbeeLuxembourgerMacedonianMalaysianMalteseMarshalleseMenomineeMexicanMexican American IndianMongolianMoroccanNative HawaiianNavajoNepaleseNew ZealanderNicaraguanNigerianNorthern EuropeanNorwegianOkinawanOsageOttawaPaiutePakistaniPalestinianPanamanianParaguayanPennsylvania GermanPeruvianPimaPolishPortuguesePotawatomiPuebloPuerto RicanPuget Sound SalishRomanianRussianSalvadoranSamoanScandinavianScotch-IrishScottishSeminoleSenegaleseSerbianShoshoneSierra LeoneanSiouxSlavicSlovakSloveneSomaliSouth AfricanSouth AmericanSouth American IndianSoviet UnionSpaniardSpanishSpanish AmericanSpanish American IndianSri LankanSubsaharan AfricanSudaneseSwedishSwissSyrianTaiwaneseThaiTlingit-HaidaTohono O'OdhamTonganTrinidadian and TobagonianTsimshianTurkishU.S. Virgin IslanderUgandanUkrainianUruguayanUteVenezuelanVietnameseWelshWest IndianYakamaYaquiYugoslavianYumanYup'ikZimbabwean
Immigration
NonimmigrantsImmigrantsAfghanistanAfricaAlbaniaArgentinaArmeniaAsiaAustraliaAustriaBahamasBangladeshBarbadosBelarusBelgiumBelizeBoliviaBosnia and HerzegovinaBrazilBulgariaBurma/MyanmarCabo VerdeCambodiaCameroonCanadaCaribbeanCentral AmericaChileChinaColombiaCongoCosta RicaCroatiaCubaCzechoslovakiaDenmarkDominicaDominican RepublicEastern AfricaEastern AsiaEastern EuropeEcuadorEgyptEl SalvadorEnglandEritreaEthiopiaEuropeFijiFranceGermanyGhanaGreeceGrenadaGuatemalaGuyanaHaitiHondurasHong KongHungaryIndiaIndonesiaIranIraqIrelandIsraelItalyJamaicaJapanJordanKazakhstanKenyaKoreaLaosLatin AmericaLatviaLebanonLiberiaLithuaniaMalaysiaMexicoMicronesiaMiddle AfricaMoldovaMoroccoNepalNetherlandsNicaraguaNigeriaNorth AmericaNorth MacedoniaNorthern AfricaNorthern EuropeNorwayOceaniaPakistanPanamaPeruPhilippinesPolandPortugalRomaniaRussiaSaudi ArabiaScotlandSenegalSerbiaSierra LeoneSingaporeSomaliaSouth AfricaSouth AmericaSouth Central AsiaSouth Eastern AsiaSouthern EuropeSpainSri LankaSt. Vincent and the GrenadinesSudanSwedenSwitzerlandSyriaTaiwanThailandTrinidad and TobagoTurkeyUgandaUkraineUruguayUzbekistanVenezuelaVietnamWest IndiesWestern AfricaWestern AsiaWestern EuropeYemenZaireZimbabweAzores
Self-Care Disability
Income
Poverty
Unemployment
Labor Participation
Family Structure
Vehicle Availability
Education Level
Disability

Immigrants from Kuwait Self-Care Disability
Exceptional

2.2%
SELF-CARE DISABILITY
100.0/ 100
METRIC RATING
16th/ 347
METRIC RANK

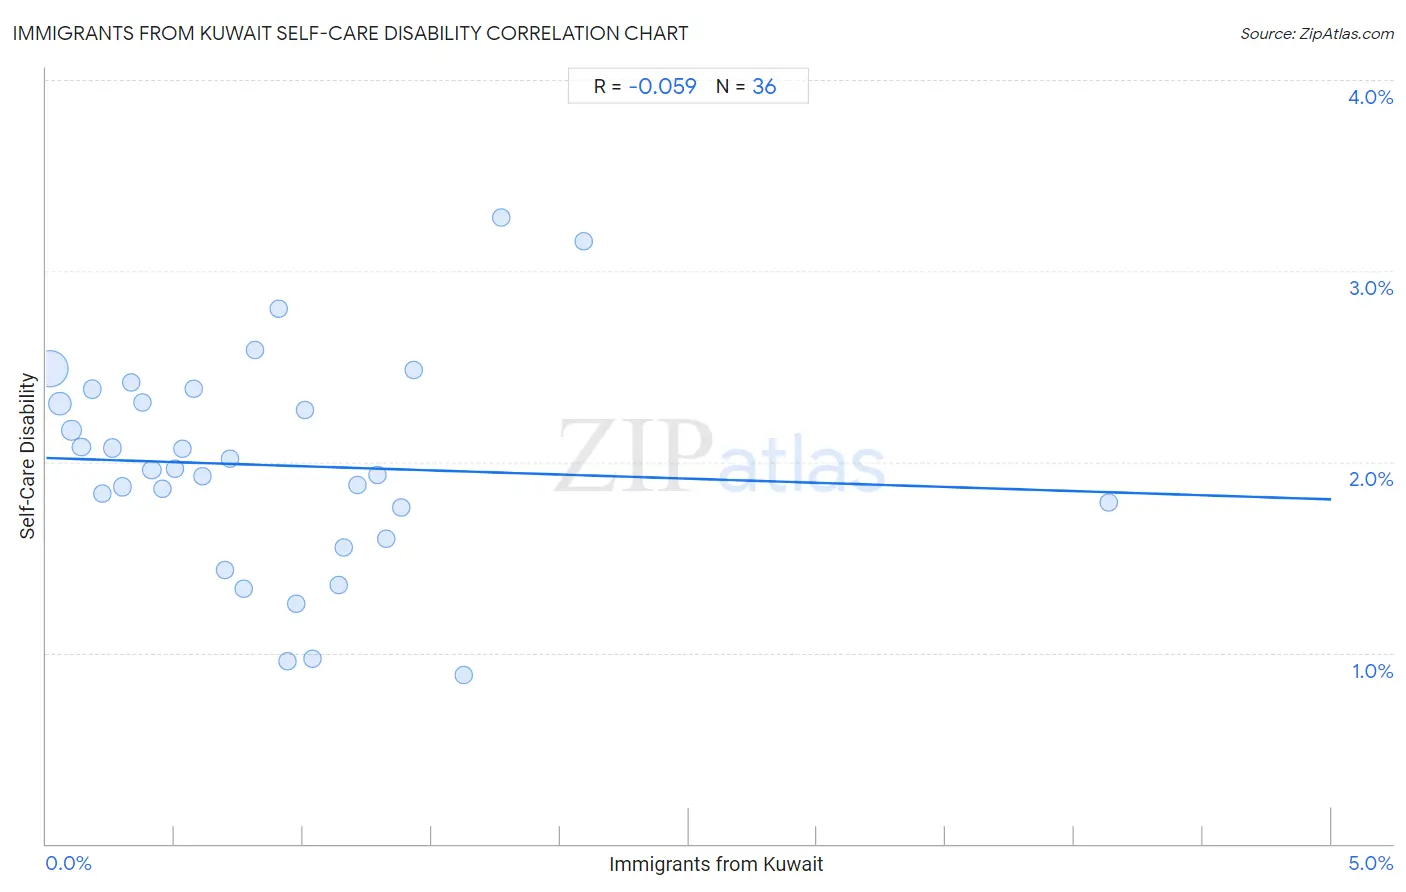
Immigrants from Kuwait Self-Care Disability Correlation Chart

The statistical analysis conducted on geographies consisting of 136,859,036 people shows a slight negative correlation between the proportion of Immigrants from Kuwait and percentage of population with self-care disability in the United States with a correlation coefficient (R) of -0.059 and weighted average of 2.2%. On average, for every 1% (one percent) increase in Immigrants from Kuwait within a typical geography, there is a decrease of 0.043% in percentage of population with self-care disability.
Immigrants from Kuwait Self-Care Disability
It is essential to understand that the correlation between the percentage of Immigrants from Kuwait and percentage of population with self-care disability does not imply a direct cause-and-effect relationship. It remains uncertain whether the presence of Immigrants from Kuwait influences an upward or downward trend in the level of percentage of population with self-care disability within an area, or if Immigrants from Kuwait simply ended up residing in those areas with higher or lower levels of percentage of population with self-care disability due to other factors.

Demographics Similar to Immigrants from Kuwait by Self-Care Disability

In terms of self-care disability, the demographic groups most similar to Immigrants from Kuwait are Immigrants from Saudi Arabia (2.2%, a difference of 0.16%), Okinawan (2.2%, a difference of 0.28%), Luxembourger (2.2%, a difference of 0.29%), Immigrants from Taiwan (2.2%, a difference of 0.42%), and Ethiopian (2.2%, a difference of 0.45%).
DemographicsRating | RankSelf-Care Disability
Immigrants from Nepal
100.0
/100
|
#9
Exceptional
2.2%
Sudanese
100.0
/100
|
#10
Exceptional
2.2%
Immigrants from South Central Asia
100.0
/100
|
#11
Exceptional
2.2%
Immigrants from Ethiopia
100.0
/100
|
#12
Exceptional
2.2%
Ethiopians
100.0
/100
|
#13
Exceptional
2.2%
Luxembourgers
100.0
/100
|
#14
Exceptional
2.2%
Okinawans
100.0
/100
|
#15
Exceptional
2.2%
Immigrants from Kuwait
100.0
/100
|
#16
Exceptional
2.2%
Immigrants from Saudi Arabia
100.0
/100
|
#17
Exceptional
2.2%
Immigrants from Taiwan
100.0
/100
|
#18
Exceptional
2.2%
Immigrants from Eritrea
100.0
/100
|
#19
Exceptional
2.2%
Tongans
100.0
/100
|
#20
Exceptional
2.2%
Bulgarians
100.0
/100
|
#21
Exceptional
2.2%
Immigrants from Venezuela
100.0
/100
|
#22
Exceptional
2.2%
Cambodians
100.0
/100
|
#23
Exceptional
2.2%

Immigrants from Kuwait Self-Care Disability Correlation Summary

MeasurementImmigrants from Kuwait DataSelf-Care Disability Data
Minimum0.016%0.88%
Maximum4.1%3.3%
Range4.1%2.4%
Mean0.87%2.0%
Median0.74%2.0%
Interquartile 25% (IQ1)0.35%1.7%
Interquartile 75% (IQ3)1.2%2.3%
Interquartile Range (IQR)0.83%0.67%
Standard Deviation (Sample)0.76%0.56%
Standard Deviation (Population)0.75%0.55%

Correlation Details

Immigrants from Kuwait PercentileSample SizeSelf-Care Disability
[
0.0%
-
0.5%
]
0.016%
90,412,1642.5%
[
0.0%
-
0.5%
]
0.055%
25,048,9832.3%
[
0.0%
-
0.5%
]
0.098%
9,262,2962.2%
[
0.0%
-
0.5%
]
0.14%
4,653,4732.1%
[
0.0%
-
0.5%
]
0.18%
2,136,9232.4%
[
0.0%
-
0.5%
]
0.22%
1,590,4341.8%
[
0.0%
-
0.5%
]
0.26%
952,5662.1%
[
0.0%
-
0.5%
]
0.30%
634,9841.9%
[
0.0%
-
0.5%
]
0.33%
395,7702.4%
[
0.0%
-
0.5%
]
0.37%
344,8662.3%
[
0.0%
-
0.5%
]
0.41%
450,5912.0%
[
0.0%
-
0.5%
]
0.45%
176,7821.9%
[
0.5%
-
1.0%
]
0.50%
132,5712.0%
[
0.5%
-
1.0%
]
0.53%
141,2222.1%
[
0.5%
-
1.0%
]
0.57%
65,6322.4%
[
0.5%
-
1.0%
]
0.61%
42,3641.9%
[
0.5%
-
1.0%
]
0.70%
48,2731.4%
[
0.5%
-
1.0%
]
0.72%
36,2432.0%
[
0.5%
-
1.0%
]
0.77%
21,7981.3%
[
0.5%
-
1.0%
]
0.81%
37,5832.6%
[
0.5%
-
1.0%
]
0.90%
23,1362.8%
[
0.5%
-
1.0%
]
0.94%
11,2650.96%
[
0.5%
-
1.0%
]
0.97%
42,8621.3%
[
1.0%
-
1.5%
]
1.01%
12,0072.3%
[
1.0%
-
1.5%
]
1.04%
8,4030.97%
[
1.0%
-
1.5%
]
1.14%
30,2201.4%
[
1.0%
-
1.5%
]
1.16%
3,2001.5%
[
1.0%
-
1.5%
]
1.21%
21,3421.9%
[
1.0%
-
1.5%
]
1.29%
3,4191.9%
[
1.0%
-
1.5%
]
1.32%
46,4731.6%
[
1.0%
-
1.5%
]
1.38%
5,2051.8%
[
1.0%
-
1.5%
]
1.43%
34,1482.5%
[
1.5%
-
2.0%
]
1.62%
26,7080.88%
[
1.5%
-
2.0%
]
1.77%
1,4673.3%
[
2.0%
-
2.5%
]
2.09%
1,2443.2%
[
4.0%
-
4.5%
]
4.13%
2,4191.8%