Immigrants from Kuwait Married-couple Households
COMPARE
Immigrants from Kuwait
Select to Compare
Married-couple Households
Immigrants from Kuwait Married-couple Households
46.0%
MARRIED-COUPLE HOUSEHOLDS
25.6/ 100
METRIC RATING
190th/ 347
METRIC RANK
Immigrants from Kuwait Married-couple Households Correlation Chart
The statistical analysis conducted on geographies consisting of 136,888,250 people shows no correlation between the proportion of Immigrants from Kuwait and percentage of married-couple family households in the United States with a correlation coefficient (R) of -0.008 and weighted average of 46.0%. On average, for every 1% (one percent) increase in Immigrants from Kuwait within a typical geography, there is a decrease of 0.060% in percentage of married-couple family households.
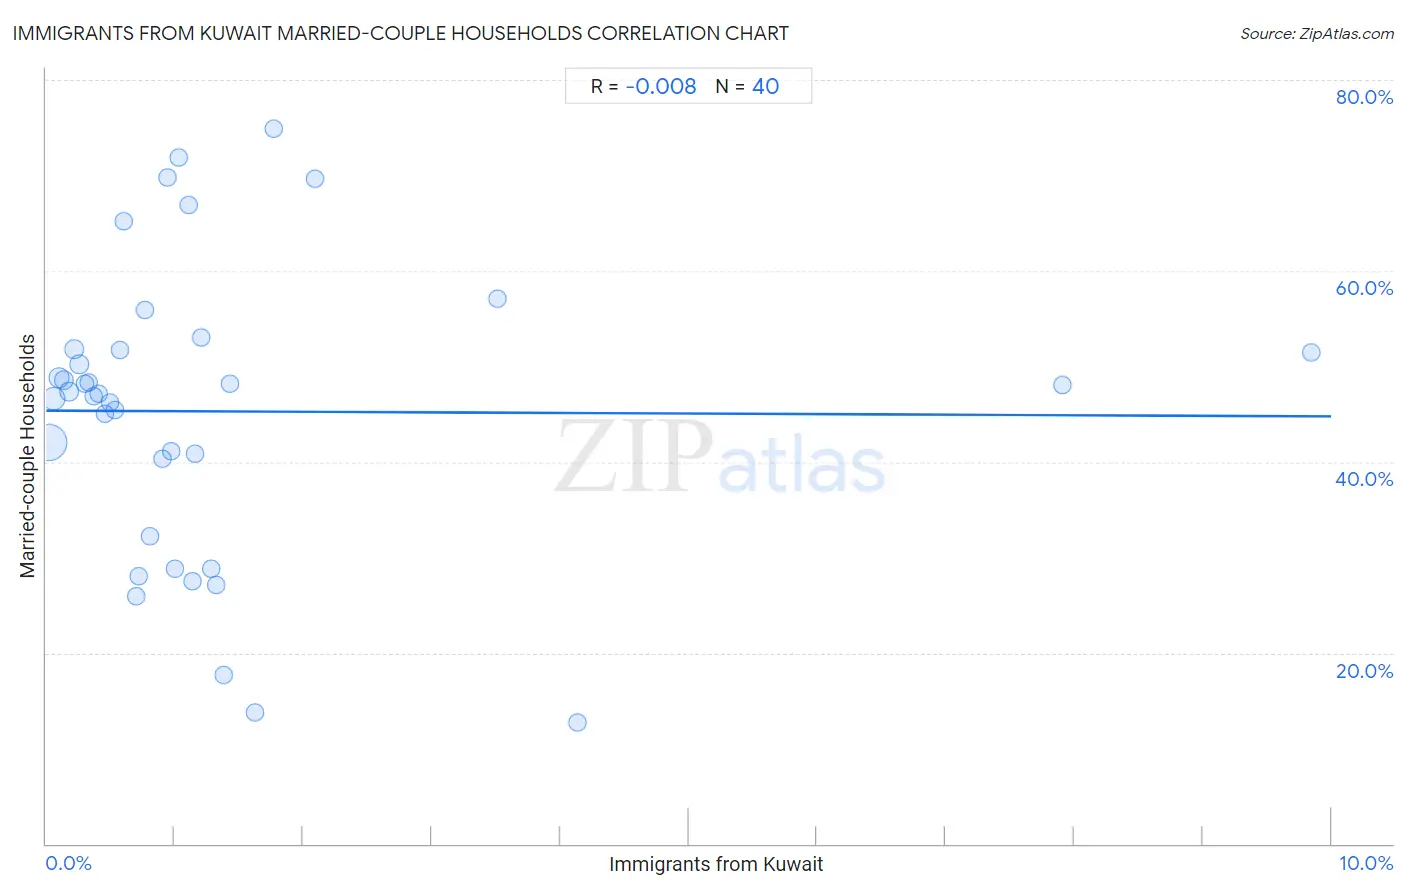
It is essential to understand that the correlation between the percentage of Immigrants from Kuwait and percentage of married-couple family households does not imply a direct cause-and-effect relationship. It remains uncertain whether the presence of Immigrants from Kuwait influences an upward or downward trend in the level of percentage of married-couple family households within an area, or if Immigrants from Kuwait simply ended up residing in those areas with higher or lower levels of percentage of married-couple family households due to other factors.
Demographics Similar to Immigrants from Kuwait by Married-couple Households
In terms of married-couple households, the demographic groups most similar to Immigrants from Kuwait are Choctaw (46.0%, a difference of 0.030%), Immigrants from Northern Africa (46.0%, a difference of 0.050%), Immigrants from Latvia (46.0%, a difference of 0.060%), Taiwanese (45.9%, a difference of 0.11%), and Mexican American Indian (45.9%, a difference of 0.12%).
| Demographics | Rating | Rank | Married-couple Households |
| Immigrants from Brazil | 38.3 /100 | #183 | Fair 46.2% |
| Immigrants from Switzerland | 36.9 /100 | #184 | Fair 46.2% |
| Brazilians | 35.9 /100 | #185 | Fair 46.2% |
| Albanians | 31.1 /100 | #186 | Fair 46.1% |
| Fijians | 29.2 /100 | #187 | Fair 46.1% |
| South American Indians | 28.4 /100 | #188 | Fair 46.0% |
| Immigrants from Latvia | 26.9 /100 | #189 | Fair 46.0% |
| Immigrants from Kuwait | 25.6 /100 | #190 | Fair 46.0% |
| Choctaw | 24.9 /100 | #191 | Fair 46.0% |
| Immigrants from Northern Africa | 24.6 /100 | #192 | Fair 46.0% |
| Taiwanese | 23.4 /100 | #193 | Fair 45.9% |
| Mexican American Indians | 23.3 /100 | #194 | Fair 45.9% |
| Chickasaw | 22.7 /100 | #195 | Fair 45.9% |
| Immigrants from South America | 22.2 /100 | #196 | Fair 45.9% |
| Cambodians | 21.3 /100 | #197 | Fair 45.9% |
Immigrants from Kuwait Married-couple Households Correlation Summary
| Measurement | Immigrants from Kuwait Data | Married-couple Households Data |
| Minimum | 0.016% | 12.7% |
| Maximum | 9.8% | 74.9% |
| Range | 9.8% | 62.1% |
| Mean | 1.3% | 45.3% |
| Median | 0.86% | 47.2% |
| Interquartile 25% (IQ1) | 0.39% | 36.3% |
| Interquartile 75% (IQ3) | 1.3% | 51.7% |
| Interquartile Range (IQR) | 0.91% | 15.5% |
| Standard Deviation (Sample) | 2.0% | 15.3% |
| Standard Deviation (Population) | 1.9% | 15.1% |
Correlation Details
| Immigrants from Kuwait Percentile | Sample Size | Married-couple Households |
[ 0.0% - 0.5% ] 0.016% | 90,418,353 | 42.1% |
[ 0.0% - 0.5% ] 0.055% | 25,048,983 | 46.6% |
[ 0.0% - 0.5% ] 0.098% | 9,262,296 | 48.8% |
[ 0.0% - 0.5% ] 0.14% | 4,653,473 | 48.5% |
[ 0.0% - 0.5% ] 0.18% | 2,151,830 | 47.3% |
[ 0.0% - 0.5% ] 0.22% | 1,590,434 | 51.8% |
[ 0.0% - 0.5% ] 0.26% | 952,566 | 50.2% |
[ 0.0% - 0.5% ] 0.30% | 634,984 | 48.2% |
[ 0.0% - 0.5% ] 0.33% | 395,770 | 48.4% |
[ 0.0% - 0.5% ] 0.37% | 344,866 | 46.9% |
[ 0.0% - 0.5% ] 0.41% | 450,591 | 47.2% |
[ 0.0% - 0.5% ] 0.45% | 176,782 | 45.1% |
[ 0.5% - 1.0% ] 0.50% | 132,571 | 46.2% |
[ 0.5% - 1.0% ] 0.53% | 141,222 | 45.5% |
[ 0.5% - 1.0% ] 0.57% | 65,632 | 51.7% |
[ 0.5% - 1.0% ] 0.61% | 42,364 | 65.1% |
[ 0.5% - 1.0% ] 0.70% | 48,273 | 26.0% |
[ 0.5% - 1.0% ] 0.72% | 36,243 | 28.0% |
[ 0.5% - 1.0% ] 0.77% | 21,798 | 55.9% |
[ 0.5% - 1.0% ] 0.81% | 37,583 | 32.2% |
[ 0.5% - 1.0% ] 0.90% | 25,130 | 40.3% |
[ 0.5% - 1.0% ] 0.94% | 11,265 | 69.8% |
[ 0.5% - 1.0% ] 0.97% | 43,068 | 41.2% |
[ 1.0% - 1.5% ] 1.01% | 13,315 | 28.9% |
[ 1.0% - 1.5% ] 1.04% | 8,403 | 71.9% |
[ 1.0% - 1.5% ] 1.11% | 1,357 | 66.9% |
[ 1.0% - 1.5% ] 1.14% | 30,220 | 27.4% |
[ 1.0% - 1.5% ] 1.16% | 3,200 | 40.9% |
[ 1.0% - 1.5% ] 1.21% | 21,342 | 53.0% |
[ 1.0% - 1.5% ] 1.29% | 3,419 | 28.8% |
[ 1.0% - 1.5% ] 1.32% | 46,473 | 27.1% |
[ 1.0% - 1.5% ] 1.38% | 5,205 | 17.7% |
[ 1.0% - 1.5% ] 1.43% | 34,148 | 48.1% |
[ 1.5% - 2.0% ] 1.62% | 26,708 | 13.8% |
[ 1.5% - 2.0% ] 1.77% | 1,467 | 74.9% |
[ 2.0% - 2.5% ] 2.09% | 1,244 | 69.7% |
[ 3.5% - 4.0% ] 3.52% | 2,332 | 57.1% |
[ 4.0% - 4.5% ] 4.13% | 2,419 | 12.7% |
[ 7.5% - 8.0% ] 7.90% | 291 | 48.1% |
[ 9.5% - 10.0% ] 9.84% | 630 | 51.5% |