Immigrants from Korea Wage/Income Gap

COMPARE

Immigrants from Korea
Race
Ancestry
AfghanAfricanAlaska NativeAlaskan AthabascanAlbanianAleutAlsatianAmericanApacheArabArapahoArgentineanArmenianAssyrian/Chaldean/SyriacAustralianAustrianBahamianBangladeshiBarbadianBasqueBelgianBelizeanBermudanBhutaneseBlackfeetBolivianBrazilianBritishBritish West IndianBulgarianBurmeseCajunCambodianCanadianCape VerdeanCarpatho RusynCelticCentral AmericanCentral American IndianCherokeeCheyenneChickasawChileanChineseChippewaChoctawColombianColvilleComancheCosta RicanCreeCreekCroatianCrowCubanCypriotCzechCzechoslovakianDanishDelawareDominicanDutchDutch West IndianEastern EuropeanEcuadorianEgyptianEnglishEstonianEthiopianEuropeanFijianFilipinoFinnishFrenchFrench American IndianFrench CanadianGermanGerman RussianGhanaianGreekGuamanian/ChamorroGuatemalanGuyaneseHaitianHmongHonduranHopiHoumaHungarianIcelanderIndian (Asian)IndonesianInupiatIranianIraqiIrishIroquoisIsraeliItalianJamaicanJapaneseJordanianKenyanKiowaKoreanLaotianLatvianLebaneseLiberianLithuanianLumbeeLuxembourgerMacedonianMalaysianMalteseMarshalleseMenomineeMexicanMexican American IndianMongolianMoroccanNative HawaiianNavajoNepaleseNew ZealanderNicaraguanNigerianNorthern EuropeanNorwegianOkinawanOsageOttawaPaiutePakistaniPalestinianPanamanianParaguayanPennsylvania GermanPeruvianPimaPolishPortuguesePotawatomiPuebloPuerto RicanPuget Sound SalishRomanianRussianSalvadoranSamoanScandinavianScotch-IrishScottishSeminoleSenegaleseSerbianShoshoneSierra LeoneanSiouxSlavicSlovakSloveneSomaliSouth AfricanSouth AmericanSouth American IndianSoviet UnionSpaniardSpanishSpanish AmericanSpanish American IndianSri LankanSubsaharan AfricanSudaneseSwedishSwissSyrianTaiwaneseThaiTlingit-HaidaTohono O'OdhamTonganTrinidadian and TobagonianTsimshianTurkishU.S. Virgin IslanderUgandanUkrainianUruguayanUteVenezuelanVietnameseWelshWest IndianYakamaYaquiYugoslavianYumanYup'ikZimbabwean
Immigration
NonimmigrantsImmigrantsAfghanistanAfricaAlbaniaArgentinaArmeniaAsiaAustraliaAustriaBahamasBangladeshBarbadosBelarusBelgiumBelizeBoliviaBosnia and HerzegovinaBrazilBulgariaBurma/MyanmarCabo VerdeCambodiaCameroonCanadaCaribbeanCentral AmericaChileChinaColombiaCongoCosta RicaCroatiaCubaCzechoslovakiaDenmarkDominicaDominican RepublicEastern AfricaEastern AsiaEastern EuropeEcuadorEgyptEl SalvadorEnglandEritreaEthiopiaEuropeFijiFranceGermanyGhanaGreeceGrenadaGuatemalaGuyanaHaitiHondurasHong KongHungaryIndiaIndonesiaIranIraqIrelandIsraelItalyJamaicaJapanJordanKazakhstanKenyaKoreaKuwaitLaosLatin AmericaLatviaLebanonLiberiaLithuaniaMalaysiaMexicoMicronesiaMiddle AfricaMoldovaMoroccoNepalNetherlandsNicaraguaNigeriaNorth AmericaNorth MacedoniaNorthern AfricaNorthern EuropeNorwayOceaniaPakistanPanamaPeruPhilippinesPolandPortugalRomaniaRussiaSaudi ArabiaScotlandSenegalSerbiaSierra LeoneSingaporeSomaliaSouth AfricaSouth AmericaSouth Central AsiaSouth Eastern AsiaSouthern EuropeSpainSri LankaSt. Vincent and the GrenadinesSudanSwedenSwitzerlandSyriaTaiwanThailandTrinidad and TobagoTurkeyUgandaUkraineUruguayUzbekistanVenezuelaVietnamWest IndiesWestern AfricaWestern AsiaWestern EuropeYemenZaireZimbabweAzores
Select to Compare
Race
Ancestry
AfghanAfricanAlaska NativeAlaskan AthabascanAlbanianAleutAlsatianAmericanApacheArabArapahoArgentineanArmenianAssyrian/Chaldean/SyriacAustralianAustrianBahamianBangladeshiBarbadianBasqueBelgianBelizeanBermudanBhutaneseBlackfeetBolivianBrazilianBritishBritish West IndianBulgarianBurmeseCajunCambodianCanadianCape VerdeanCarpatho RusynCelticCentral AmericanCentral American IndianCherokeeCheyenneChickasawChileanChineseChippewaChoctawColombianColvilleComancheCosta RicanCreeCreekCroatianCrowCubanCypriotCzechCzechoslovakianDanishDelawareDominicanDutchDutch West IndianEastern EuropeanEcuadorianEgyptianEnglishEstonianEthiopianEuropeanFijianFilipinoFinnishFrenchFrench American IndianFrench CanadianGermanGerman RussianGhanaianGreekGuamanian/ChamorroGuatemalanGuyaneseHaitianHmongHonduranHopiHoumaHungarianIcelanderIndian (Asian)IndonesianInupiatIranianIraqiIrishIroquoisIsraeliItalianJamaicanJapaneseJordanianKenyanKiowaKoreanLaotianLatvianLebaneseLiberianLithuanianLumbeeLuxembourgerMacedonianMalaysianMalteseMarshalleseMenomineeMexicanMexican American IndianMongolianMoroccanNative HawaiianNavajoNepaleseNew ZealanderNicaraguanNigerianNorthern EuropeanNorwegianOkinawanOsageOttawaPaiutePakistaniPalestinianPanamanianParaguayanPennsylvania GermanPeruvianPimaPolishPortuguesePotawatomiPuebloPuerto RicanPuget Sound SalishRomanianRussianSalvadoranSamoanScandinavianScotch-IrishScottishSeminoleSenegaleseSerbianShoshoneSierra LeoneanSiouxSlavicSlovakSloveneSomaliSouth AfricanSouth AmericanSouth American IndianSoviet UnionSpaniardSpanishSpanish AmericanSpanish American IndianSri LankanSubsaharan AfricanSudaneseSwedishSwissSyrianTaiwaneseThaiTlingit-HaidaTohono O'OdhamTonganTrinidadian and TobagonianTsimshianTurkishU.S. Virgin IslanderUgandanUkrainianUruguayanUteVenezuelanVietnameseWelshWest IndianYakamaYaquiYugoslavianYumanYup'ikZimbabwean
Immigration
NonimmigrantsImmigrantsAfghanistanAfricaAlbaniaArgentinaArmeniaAsiaAustraliaAustriaBahamasBangladeshBarbadosBelarusBelgiumBelizeBoliviaBosnia and HerzegovinaBrazilBulgariaBurma/MyanmarCabo VerdeCambodiaCameroonCanadaCaribbeanCentral AmericaChileChinaColombiaCongoCosta RicaCroatiaCubaCzechoslovakiaDenmarkDominicaDominican RepublicEastern AfricaEastern AsiaEastern EuropeEcuadorEgyptEl SalvadorEnglandEritreaEthiopiaEuropeFijiFranceGermanyGhanaGreeceGrenadaGuatemalaGuyanaHaitiHondurasHong KongHungaryIndiaIndonesiaIranIraqIrelandIsraelItalyJamaicaJapanJordanKazakhstanKenyaKuwaitLaosLatin AmericaLatviaLebanonLiberiaLithuaniaMalaysiaMexicoMicronesiaMiddle AfricaMoldovaMoroccoNepalNetherlandsNicaraguaNigeriaNorth AmericaNorth MacedoniaNorthern AfricaNorthern EuropeNorwayOceaniaPakistanPanamaPeruPhilippinesPolandPortugalRomaniaRussiaSaudi ArabiaScotlandSenegalSerbiaSierra LeoneSingaporeSomaliaSouth AfricaSouth AmericaSouth Central AsiaSouth Eastern AsiaSouthern EuropeSpainSri LankaSt. Vincent and the GrenadinesSudanSwedenSwitzerlandSyriaTaiwanThailandTrinidad and TobagoTurkeyUgandaUkraineUruguayUzbekistanVenezuelaVietnamWest IndiesWestern AfricaWestern AsiaWestern EuropeYemenZaireZimbabweAzores
Wage/Income Gap
Income
Poverty
Unemployment
Labor Participation
Family Structure
Vehicle Availability
Education Level
Disability

Immigrants from Korea Wage/Income Gap
Tragic

27.8%
WAGE/INCOME GAP
0.8/ 100
METRIC RATING
272nd/ 347
METRIC RANK

Immigrants from Korea Wage/Income Gap Correlation Chart

The statistical analysis conducted on geographies consisting of 416,007,882 people shows no correlation between the proportion of Immigrants from Korea and wage/income gap percentage in the United States with a correlation coefficient (R) of -0.009 and weighted average of 27.8%. On average, for every 1% (one percent) increase in Immigrants from Korea within a typical geography, there is a decrease of 0.013% in wage/income gap percentage.
Immigrants from Korea Wage/Income Gap
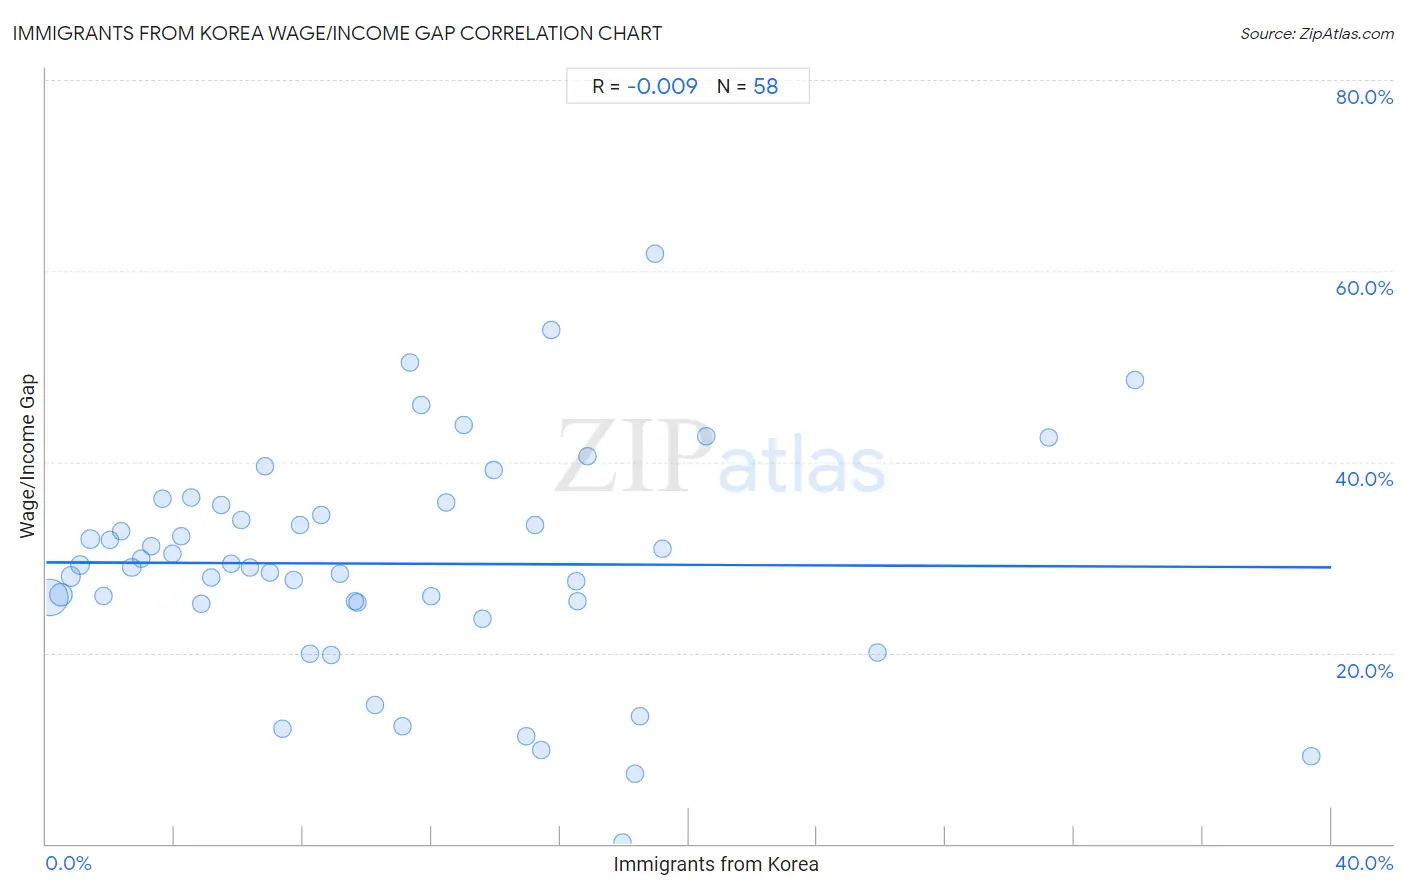
It is essential to understand that the correlation between the percentage of Immigrants from Korea and wage/income gap percentage does not imply a direct cause-and-effect relationship. It remains uncertain whether the presence of Immigrants from Korea influences an upward or downward trend in the level of wage/income gap percentage within an area, or if Immigrants from Korea simply ended up residing in those areas with higher or lower levels of wage/income gap percentage due to other factors.

Demographics Similar to Immigrants from Korea by Wage/Income Gap

In terms of wage/income gap, the demographic groups most similar to Immigrants from Korea are Ute (27.8%, a difference of 0.070%), Bulgarian (27.8%, a difference of 0.11%), Immigrants from Western Europe (27.8%, a difference of 0.15%), American (27.8%, a difference of 0.15%), and Immigrants from Japan (27.9%, a difference of 0.23%).
DemographicsRating | RankWage/Income Gap
Serbians
1.0
/100
|
#265
Tragic
27.7%
Hmong
1.0
/100
|
#266
Tragic
27.7%
Turks
1.0
/100
|
#267
Tragic
27.7%
New Zealanders
1.0
/100
|
#268
Tragic
27.7%
Potawatomi
0.9
/100
|
#269
Tragic
27.7%
Immigrants from Western Europe
0.9
/100
|
#270
Tragic
27.8%
Ute
0.8
/100
|
#271
Tragic
27.8%
Immigrants from Korea
0.8
/100
|
#272
Tragic
27.8%
Bulgarians
0.7
/100
|
#273
Tragic
27.8%
Americans
0.7
/100
|
#274
Tragic
27.8%
Immigrants from Japan
0.7
/100
|
#275
Tragic
27.9%
Lebanese
0.7
/100
|
#276
Tragic
27.9%
Latvians
0.7
/100
|
#277
Tragic
27.9%
Immigrants from England
0.6
/100
|
#278
Tragic
27.9%
Romanians
0.5
/100
|
#279
Tragic
28.0%

Immigrants from Korea Wage/Income Gap Correlation Summary

MeasurementImmigrants from Korea DataWage/Income Gap Data
Minimum0.13%0.13%
Maximum39.4%61.8%
Range39.3%61.7%
Mean10.8%29.3%
Median9.0%29.1%
Interquartile 25% (IQ1)4.5%25.3%
Interquartile 75% (IQ3)15.4%35.5%
Interquartile Range (IQR)10.9%10.2%
Standard Deviation (Sample)8.3%11.7%
Standard Deviation (Population)8.3%11.6%

Correlation Details

Immigrants from Korea PercentileSample SizeWage/Income Gap
[
0.0%
-
0.5%
]
0.13%
262,234,27125.8%
[
0.0%
-
0.5%
]
0.45%
78,325,42626.1%
[
0.5%
-
1.0%
]
0.76%
29,308,96528.0%
[
1.0%
-
1.5%
]
1.07%
15,815,70629.2%
[
1.0%
-
1.5%
]
1.37%
7,634,76831.9%
[
1.5%
-
2.0%
]
1.78%
7,700,82026.0%
[
1.5%
-
2.0%
]
1.99%
3,162,09231.8%
[
2.0%
-
2.5%
]
2.32%
1,945,57232.7%
[
2.5%
-
3.0%
]
2.66%
1,753,76029.0%
[
2.5%
-
3.0%
]
2.96%
1,387,87129.8%
[
3.0%
-
3.5%
]
3.28%
959,87031.2%
[
3.5%
-
4.0%
]
3.60%
603,49836.2%
[
3.5%
-
4.0%
]
3.93%
452,68430.3%
[
4.0%
-
4.5%
]
4.20%
498,12632.3%
[
4.5%
-
5.0%
]
4.51%
586,35636.3%
[
4.5%
-
5.0%
]
4.83%
482,42125.2%
[
5.0%
-
5.5%
]
5.12%
203,39327.8%
[
5.0%
-
5.5%
]
5.45%
233,30835.5%
[
5.5%
-
6.0%
]
5.76%
262,09529.3%
[
6.0%
-
6.5%
]
6.05%
184,02633.9%
[
6.0%
-
6.5%
]
6.33%
198,89929.0%
[
6.5%
-
7.0%
]
6.79%
163,58339.5%
[
6.5%
-
7.0%
]
6.96%
87,48028.4%
[
7.0%
-
7.5%
]
7.37%
93,66912.1%
[
7.5%
-
8.0%
]
7.69%
228,12927.7%
[
7.5%
-
8.0%
]
7.91%
170,00733.3%
[
8.0%
-
8.5%
]
8.21%
236,76619.9%
[
8.5%
-
9.0%
]
8.56%
189,41034.4%
[
8.5%
-
9.0%
]
8.85%
147,42619.8%
[
9.0%
-
9.5%
]
9.16%
51,08928.2%
[
9.5%
-
10.0%
]
9.62%
31,42625.4%
[
9.5%
-
10.0%
]
9.69%
98,26725.3%
[
10.0%
-
10.5%
]
10.25%
37,73514.5%
[
11.0%
-
11.5%
]
11.09%
56,62812.3%
[
11.0%
-
11.5%
]
11.33%
4,45850.4%
[
11.5%
-
12.0%
]
11.68%
35145.9%
[
11.5%
-
12.0%
]
11.98%
9,27326.0%
[
12.0%
-
12.5%
]
12.46%
30,59835.8%
[
13.0%
-
13.5%
]
13.01%
10,81943.9%
[
13.5%
-
14.0%
]
13.57%
36,15123.6%
[
13.5%
-
14.0%
]
13.94%
48,79639.2%
[
14.5%
-
15.0%
]
14.94%
8711.2%
[
15.0%
-
15.5%
]
15.20%
52,79933.4%
[
15.0%
-
15.5%
]
15.40%
5,3369.8%
[
15.5%
-
16.0%
]
15.71%
18,21053.8%
[
16.0%
-
16.5%
]
16.49%
40,28527.5%
[
16.5%
-
17.0%
]
16.52%
44,55025.4%
[
16.5%
-
17.0%
]
16.84%
68940.6%
[
17.5%
-
18.0%
]
17.93%
37,7540.13%
[
18.0%
-
18.5%
]
18.33%
38,4007.3%
[
18.0%
-
18.5%
]
18.50%
18,56413.4%
[
18.5%
-
19.0%
]
18.97%
5,86361.8%
[
19.0%
-
19.5%
]
19.20%
22,93030.9%
[
20.5%
-
21.0%
]
20.56%
11,31442.7%
[
25.5%
-
26.0%
]
25.89%
22420.1%
[
31.0%
-
31.5%
]
31.21%
4,18542.6%
[
33.5%
-
34.0%
]
33.88%
24248.6%
[
39.0%
-
39.5%
]
39.39%
40,4629.2%