Immigrants from Korea Married-couple Households
COMPARE
Immigrants from Korea
Select to Compare
Married-couple Households
Immigrants from Korea Married-couple Households
49.9%
MARRIED-COUPLE HOUSEHOLDS
100.0/ 100
METRIC RATING
13th/ 347
METRIC RANK
Immigrants from Korea Married-couple Households Correlation Chart
The statistical analysis conducted on geographies consisting of 415,948,029 people shows no correlation between the proportion of Immigrants from Korea and percentage of married-couple family households in the United States with a correlation coefficient (R) of 0.038 and weighted average of 49.9%. On average, for every 1% (one percent) increase in Immigrants from Korea within a typical geography, there is an increase of 0.059% in percentage of married-couple family households.
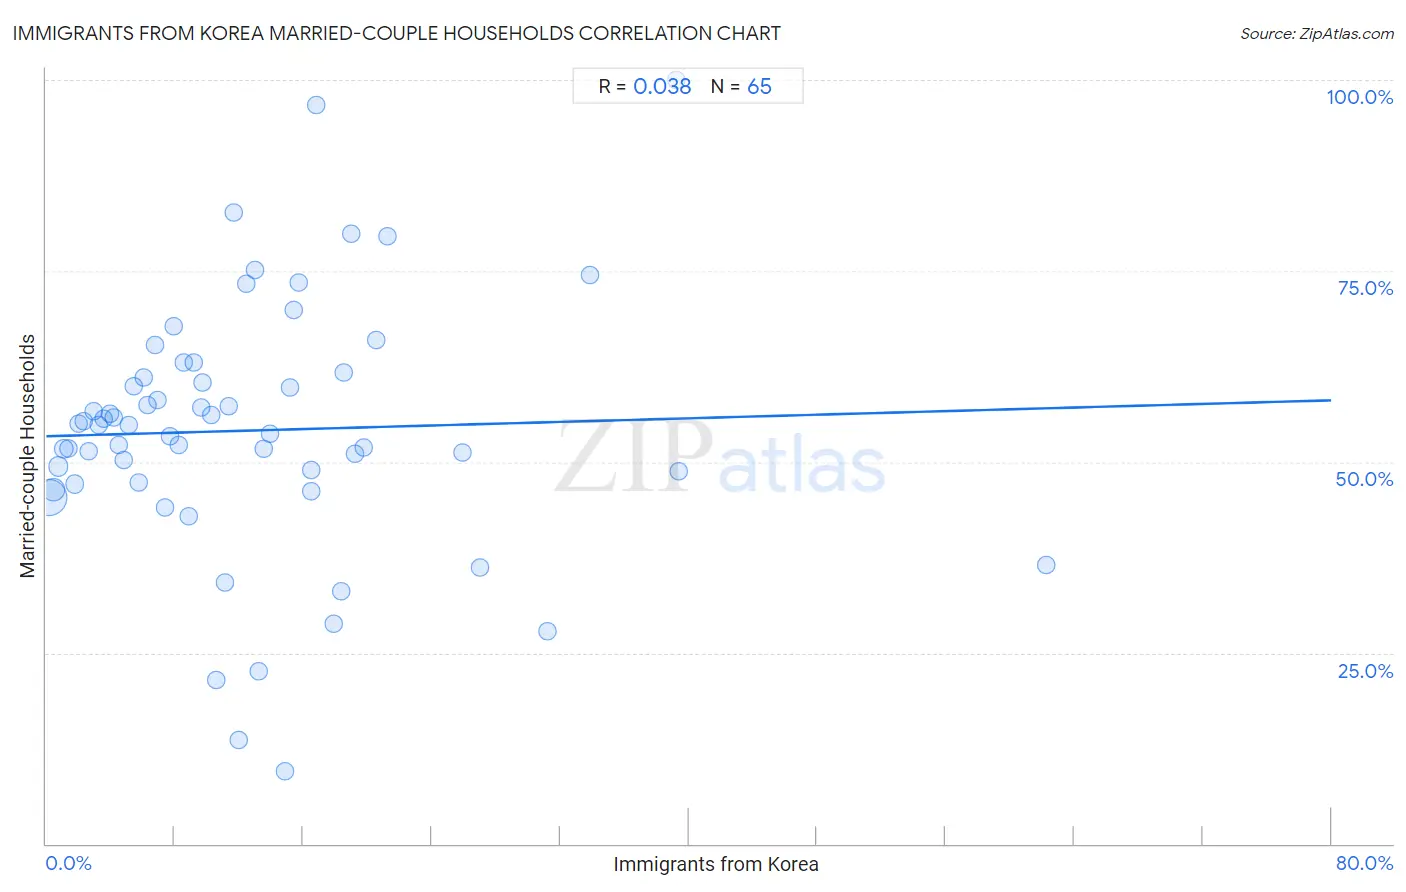
It is essential to understand that the correlation between the percentage of Immigrants from Korea and percentage of married-couple family households does not imply a direct cause-and-effect relationship. It remains uncertain whether the presence of Immigrants from Korea influences an upward or downward trend in the level of percentage of married-couple family households within an area, or if Immigrants from Korea simply ended up residing in those areas with higher or lower levels of percentage of married-couple family households due to other factors.
Demographics Similar to Immigrants from Korea by Married-couple Households
In terms of married-couple households, the demographic groups most similar to Immigrants from Korea are Burmese (49.8%, a difference of 0.13%), Swiss (49.9%, a difference of 0.17%), Korean (49.7%, a difference of 0.27%), Swedish (49.7%, a difference of 0.30%), and Immigrants from Hong Kong (49.6%, a difference of 0.46%).
| Demographics | Rating | Rank | Married-couple Households |
| Danes | 100.0 /100 | #6 | Exceptional 51.1% |
| Filipinos | 100.0 /100 | #7 | Exceptional 51.0% |
| Immigrants from South Central Asia | 100.0 /100 | #8 | Exceptional 50.6% |
| Pennsylvania Germans | 100.0 /100 | #9 | Exceptional 50.4% |
| Chinese | 100.0 /100 | #10 | Exceptional 50.4% |
| Immigrants from Pakistan | 100.0 /100 | #11 | Exceptional 50.1% |
| Swiss | 100.0 /100 | #12 | Exceptional 49.9% |
| Immigrants from Korea | 100.0 /100 | #13 | Exceptional 49.9% |
| Burmese | 100.0 /100 | #14 | Exceptional 49.8% |
| Koreans | 99.9 /100 | #15 | Exceptional 49.7% |
| Swedes | 99.9 /100 | #16 | Exceptional 49.7% |
| Immigrants from Hong Kong | 99.9 /100 | #17 | Exceptional 49.6% |
| English | 99.9 /100 | #18 | Exceptional 49.6% |
| Europeans | 99.9 /100 | #19 | Exceptional 49.6% |
| Scandinavians | 99.9 /100 | #20 | Exceptional 49.6% |
Immigrants from Korea Married-couple Households Correlation Summary
| Measurement | Immigrants from Korea Data | Married-couple Households Data |
| Minimum | 0.13% | 9.4% |
| Maximum | 62.3% | 100.0% |
| Range | 62.1% | 90.6% |
| Mean | 12.6% | 54.1% |
| Median | 10.2% | 54.9% |
| Interquartile 25% (IQ1) | 5.0% | 47.2% |
| Interquartile 75% (IQ3) | 16.7% | 61.4% |
| Interquartile Range (IQR) | 11.7% | 14.2% |
| Standard Deviation (Sample) | 10.9% | 16.7% |
| Standard Deviation (Population) | 10.9% | 16.6% |
Correlation Details
| Immigrants from Korea Percentile | Sample Size | Married-couple Households |
[ 0.0% - 0.5% ] 0.13% | 262,196,736 | 45.4% |
[ 0.0% - 0.5% ] 0.45% | 78,301,175 | 46.4% |
[ 0.5% - 1.0% ] 0.76% | 29,272,866 | 49.4% |
[ 1.0% - 1.5% ] 1.07% | 15,812,335 | 51.6% |
[ 1.0% - 1.5% ] 1.37% | 7,650,129 | 51.8% |
[ 1.5% - 2.0% ] 1.78% | 7,705,800 | 47.1% |
[ 1.5% - 2.0% ] 1.99% | 3,158,937 | 55.0% |
[ 2.0% - 2.5% ] 2.32% | 1,953,175 | 55.4% |
[ 2.5% - 3.0% ] 2.66% | 1,749,536 | 51.3% |
[ 2.5% - 3.0% ] 2.96% | 1,392,533 | 56.7% |
[ 3.0% - 3.5% ] 3.28% | 959,798 | 54.9% |
[ 3.5% - 4.0% ] 3.60% | 604,542 | 55.7% |
[ 3.5% - 4.0% ] 3.93% | 454,169 | 56.3% |
[ 4.0% - 4.5% ] 4.20% | 498,126 | 55.9% |
[ 4.5% - 5.0% ] 4.51% | 586,487 | 52.2% |
[ 4.5% - 5.0% ] 4.83% | 482,992 | 50.3% |
[ 5.0% - 5.5% ] 5.12% | 204,258 | 54.9% |
[ 5.0% - 5.5% ] 5.45% | 233,308 | 59.9% |
[ 5.5% - 6.0% ] 5.76% | 263,253 | 47.3% |
[ 6.0% - 6.5% ] 6.05% | 184,375 | 61.1% |
[ 6.0% - 6.5% ] 6.33% | 199,118 | 57.5% |
[ 6.5% - 7.0% ] 6.79% | 164,600 | 65.3% |
[ 6.5% - 7.0% ] 6.96% | 87,910 | 58.1% |
[ 7.0% - 7.5% ] 7.37% | 93,669 | 44.1% |
[ 7.5% - 8.0% ] 7.69% | 228,245 | 53.4% |
[ 7.5% - 8.0% ] 7.91% | 170,007 | 67.7% |
[ 8.0% - 8.5% ] 8.21% | 238,163 | 52.1% |
[ 8.5% - 9.0% ] 8.56% | 189,781 | 62.9% |
[ 8.5% - 9.0% ] 8.85% | 148,339 | 42.9% |
[ 9.0% - 9.5% ] 9.16% | 52,559 | 63.0% |
[ 9.5% - 10.0% ] 9.62% | 31,426 | 57.1% |
[ 9.5% - 10.0% ] 9.69% | 98,267 | 60.5% |
[ 10.0% - 10.5% ] 10.25% | 37,735 | 56.1% |
[ 10.5% - 11.0% ] 10.56% | 142 | 21.5% |
[ 11.0% - 11.5% ] 11.09% | 56,628 | 34.2% |
[ 11.0% - 11.5% ] 11.33% | 4,546 | 57.2% |
[ 11.5% - 12.0% ] 11.68% | 351 | 82.7% |
[ 11.5% - 12.0% ] 11.98% | 9,273 | 13.7% |
[ 12.0% - 12.5% ] 12.47% | 31,252 | 73.3% |
[ 13.0% - 13.5% ] 13.01% | 10,819 | 75.0% |
[ 13.0% - 13.5% ] 13.21% | 280 | 22.5% |
[ 13.5% - 14.0% ] 13.57% | 36,151 | 51.7% |
[ 13.5% - 14.0% ] 13.94% | 49,393 | 53.7% |
[ 14.5% - 15.0% ] 14.90% | 490 | 9.4% |
[ 15.0% - 15.5% ] 15.20% | 52,799 | 59.8% |
[ 15.0% - 15.5% ] 15.40% | 5,336 | 69.9% |
[ 15.5% - 16.0% ] 15.71% | 18,639 | 73.4% |
[ 16.0% - 16.5% ] 16.49% | 40,285 | 46.2% |
[ 16.5% - 17.0% ] 16.53% | 44,943 | 48.9% |
[ 16.5% - 17.0% ] 16.84% | 689 | 96.7% |
[ 17.5% - 18.0% ] 17.93% | 37,754 | 28.9% |
[ 18.0% - 18.5% ] 18.33% | 38,444 | 33.1% |
[ 18.0% - 18.5% ] 18.50% | 18,564 | 61.8% |
[ 18.5% - 19.0% ] 18.97% | 5,900 | 79.9% |
[ 19.0% - 19.5% ] 19.20% | 22,930 | 51.1% |
[ 19.5% - 20.0% ] 19.75% | 1,139 | 51.8% |
[ 20.5% - 21.0% ] 20.56% | 11,314 | 65.9% |
[ 21.0% - 21.5% ] 21.28% | 141 | 79.5% |
[ 25.5% - 26.0% ] 25.89% | 224 | 51.2% |
[ 27.0% - 27.5% ] 27.03% | 111 | 36.2% |
[ 31.0% - 31.5% ] 31.21% | 4,185 | 27.8% |
[ 33.5% - 34.0% ] 33.88% | 242 | 74.5% |
[ 39.0% - 39.5% ] 39.19% | 148 | 100.0% |
[ 39.0% - 39.5% ] 39.39% | 40,462 | 48.7% |
[ 62.0% - 62.5% ] 62.26% | 106 | 36.5% |