Immigrants from Korea Disability
COMPARE
Immigrants from Korea
Select to Compare
Disability
Immigrants from Korea Disability
10.2%
DISABILITY
100.0/ 100
METRIC RATING
14th/ 347
METRIC RANK
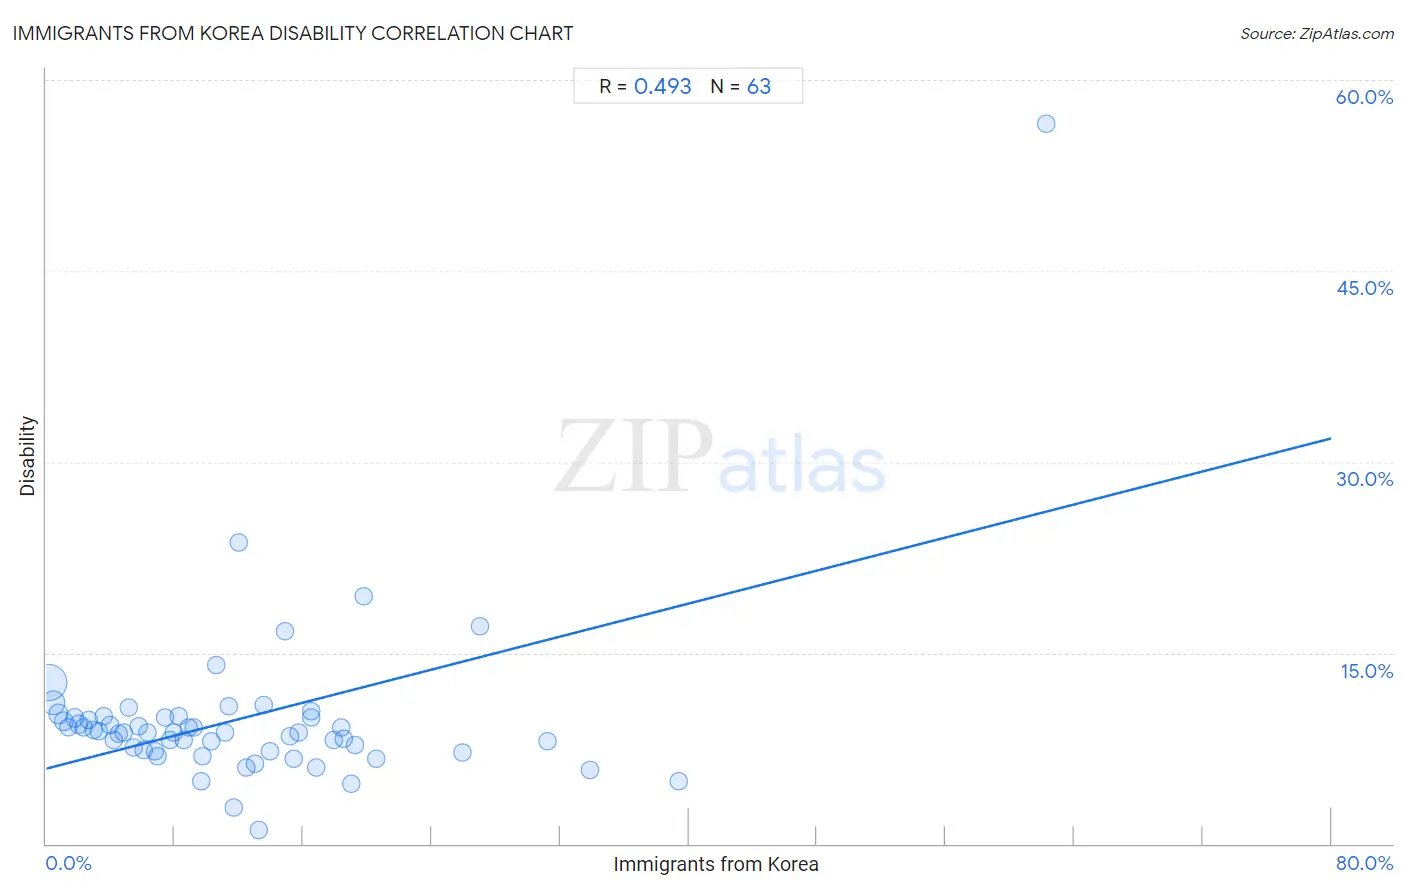
Immigrants from Korea Disability Correlation Chart
The statistical analysis conducted on geographies consisting of 416,299,820 people shows a moderate positive correlation between the proportion of Immigrants from Korea and percentage of population with a disability in the United States with a correlation coefficient (R) of 0.493 and weighted average of 10.2%. On average, for every 1% (one percent) increase in Immigrants from Korea within a typical geography, there is an increase of 0.32% in percentage of population with a disability.
It is essential to understand that the correlation between the percentage of Immigrants from Korea and percentage of population with a disability does not imply a direct cause-and-effect relationship. It remains uncertain whether the presence of Immigrants from Korea influences an upward or downward trend in the level of percentage of population with a disability within an area, or if Immigrants from Korea simply ended up residing in those areas with higher or lower levels of percentage of population with a disability due to other factors.
Demographics Similar to Immigrants from Korea by Disability
In terms of disability, the demographic groups most similar to Immigrants from Korea are Okinawan (10.3%, a difference of 0.31%), Indian (Asian) (10.3%, a difference of 0.37%), Immigrants from Iran (10.3%, a difference of 0.44%), Immigrants from Eastern Asia (10.2%, a difference of 0.60%), and Immigrants from Israel (10.1%, a difference of 0.81%).
| Demographics | Rating | Rank | Disability |
| Immigrants from Singapore | 100.0 /100 | #7 | Exceptional 10.0% |
| Bolivians | 100.0 /100 | #8 | Exceptional 10.0% |
| Immigrants from Hong Kong | 100.0 /100 | #9 | Exceptional 10.0% |
| Immigrants from China | 100.0 /100 | #10 | Exceptional 10.1% |
| Iranians | 100.0 /100 | #11 | Exceptional 10.1% |
| Immigrants from Israel | 100.0 /100 | #12 | Exceptional 10.1% |
| Immigrants from Eastern Asia | 100.0 /100 | #13 | Exceptional 10.2% |
| Immigrants from Korea | 100.0 /100 | #14 | Exceptional 10.2% |
| Okinawans | 100.0 /100 | #15 | Exceptional 10.3% |
| Indians (Asian) | 100.0 /100 | #16 | Exceptional 10.3% |
| Immigrants from Iran | 100.0 /100 | #17 | Exceptional 10.3% |
| Burmese | 100.0 /100 | #18 | Exceptional 10.4% |
| Immigrants from Pakistan | 100.0 /100 | #19 | Exceptional 10.4% |
| Immigrants from Venezuela | 100.0 /100 | #20 | Exceptional 10.4% |
| Asians | 100.0 /100 | #21 | Exceptional 10.4% |
Immigrants from Korea Disability Correlation Summary
| Measurement | Immigrants from Korea Data | Disability Data |
| Minimum | 0.13% | 1.1% |
| Maximum | 62.3% | 56.6% |
| Range | 62.1% | 55.5% |
| Mean | 12.0% | 9.8% |
| Median | 9.7% | 8.8% |
| Interquartile 25% (IQ1) | 4.8% | 7.3% |
| Interquartile 75% (IQ3) | 16.5% | 9.9% |
| Interquartile Range (IQR) | 11.7% | 2.6% |
| Standard Deviation (Sample) | 10.5% | 6.9% |
| Standard Deviation (Population) | 10.4% | 6.9% |
Correlation Details
| Immigrants from Korea Percentile | Sample Size | Disability |
[ 0.0% - 0.5% ] 0.13% | 262,316,555 | 12.7% |
[ 0.0% - 0.5% ] 0.45% | 78,400,744 | 11.1% |
[ 0.5% - 1.0% ] 0.76% | 29,332,625 | 10.2% |
[ 1.0% - 1.5% ] 1.07% | 15,837,600 | 9.7% |
[ 1.0% - 1.5% ] 1.37% | 7,658,914 | 9.1% |
[ 1.5% - 2.0% ] 1.78% | 7,712,845 | 9.9% |
[ 1.5% - 2.0% ] 1.99% | 3,170,856 | 9.4% |
[ 2.0% - 2.5% ] 2.32% | 1,956,189 | 9.2% |
[ 2.5% - 3.0% ] 2.66% | 1,759,716 | 9.7% |
[ 2.5% - 3.0% ] 2.96% | 1,398,805 | 8.9% |
[ 3.0% - 3.5% ] 3.28% | 959,798 | 8.8% |
[ 3.5% - 4.0% ] 3.60% | 605,556 | 10.0% |
[ 3.5% - 4.0% ] 3.93% | 454,648 | 9.4% |
[ 4.0% - 4.5% ] 4.20% | 497,756 | 8.2% |
[ 4.5% - 5.0% ] 4.51% | 586,487 | 8.7% |
[ 4.5% - 5.0% ] 4.83% | 482,992 | 8.8% |
[ 5.0% - 5.5% ] 5.12% | 204,258 | 10.7% |
[ 5.0% - 5.5% ] 5.45% | 233,511 | 7.5% |
[ 5.5% - 6.0% ] 5.76% | 263,253 | 9.2% |
[ 6.0% - 6.5% ] 6.05% | 184,026 | 7.4% |
[ 6.0% - 6.5% ] 6.33% | 199,118 | 8.8% |
[ 6.5% - 7.0% ] 6.79% | 164,365 | 7.3% |
[ 6.5% - 7.0% ] 6.96% | 87,910 | 6.9% |
[ 7.0% - 7.5% ] 7.37% | 93,669 | 9.9% |
[ 7.5% - 8.0% ] 7.69% | 228,245 | 8.2% |
[ 7.5% - 8.0% ] 7.91% | 170,007 | 8.7% |
[ 8.0% - 8.5% ] 8.21% | 238,163 | 10.0% |
[ 8.5% - 9.0% ] 8.56% | 189,492 | 8.2% |
[ 8.5% - 9.0% ] 8.85% | 148,339 | 9.1% |
[ 9.0% - 9.5% ] 9.16% | 52,559 | 9.2% |
[ 9.5% - 10.0% ] 9.62% | 31,426 | 4.9% |
[ 9.5% - 10.0% ] 9.69% | 98,267 | 6.8% |
[ 10.0% - 10.5% ] 10.25% | 37,735 | 8.0% |
[ 10.5% - 11.0% ] 10.56% | 142 | 14.1% |
[ 11.0% - 11.5% ] 11.09% | 56,628 | 8.7% |
[ 11.0% - 11.5% ] 11.33% | 4,546 | 10.8% |
[ 11.5% - 12.0% ] 11.68% | 351 | 2.8% |
[ 11.5% - 12.0% ] 11.98% | 9,273 | 23.7% |
[ 12.0% - 12.5% ] 12.47% | 31,252 | 6.0% |
[ 13.0% - 13.5% ] 13.01% | 10,819 | 6.3% |
[ 13.0% - 13.5% ] 13.21% | 280 | 1.1% |
[ 13.5% - 14.0% ] 13.57% | 36,151 | 10.9% |
[ 13.5% - 14.0% ] 13.94% | 49,393 | 7.3% |
[ 14.5% - 15.0% ] 14.90% | 490 | 16.7% |
[ 15.0% - 15.5% ] 15.20% | 52,799 | 8.5% |
[ 15.0% - 15.5% ] 15.40% | 5,336 | 6.7% |
[ 15.5% - 16.0% ] 15.71% | 18,639 | 8.8% |
[ 16.0% - 16.5% ] 16.49% | 40,285 | 10.4% |
[ 16.5% - 17.0% ] 16.53% | 44,943 | 9.9% |
[ 16.5% - 17.0% ] 16.84% | 689 | 6.0% |
[ 17.5% - 18.0% ] 17.93% | 37,754 | 8.1% |
[ 18.0% - 18.5% ] 18.33% | 38,444 | 9.2% |
[ 18.0% - 18.5% ] 18.50% | 18,564 | 8.3% |
[ 18.5% - 19.0% ] 18.97% | 5,900 | 4.7% |
[ 19.0% - 19.5% ] 19.20% | 22,930 | 7.7% |
[ 19.5% - 20.0% ] 19.75% | 1,139 | 19.5% |
[ 20.5% - 21.0% ] 20.56% | 11,314 | 6.7% |
[ 25.5% - 26.0% ] 25.89% | 224 | 7.1% |
[ 27.0% - 27.5% ] 27.03% | 111 | 17.1% |
[ 31.0% - 31.5% ] 31.21% | 4,185 | 8.1% |
[ 33.5% - 34.0% ] 33.88% | 242 | 5.8% |
[ 39.0% - 39.5% ] 39.39% | 40,462 | 4.9% |
[ 62.0% - 62.5% ] 62.26% | 106 | 56.6% |