Immigrants from Korea Self-Care Disability
COMPARE
Immigrants from Korea
Select to Compare
Self-Care Disability
Immigrants from Korea Self-Care Disability
2.3%
SELF-CARE DISABILITY
99.9/ 100
METRIC RATING
33rd/ 347
METRIC RANK
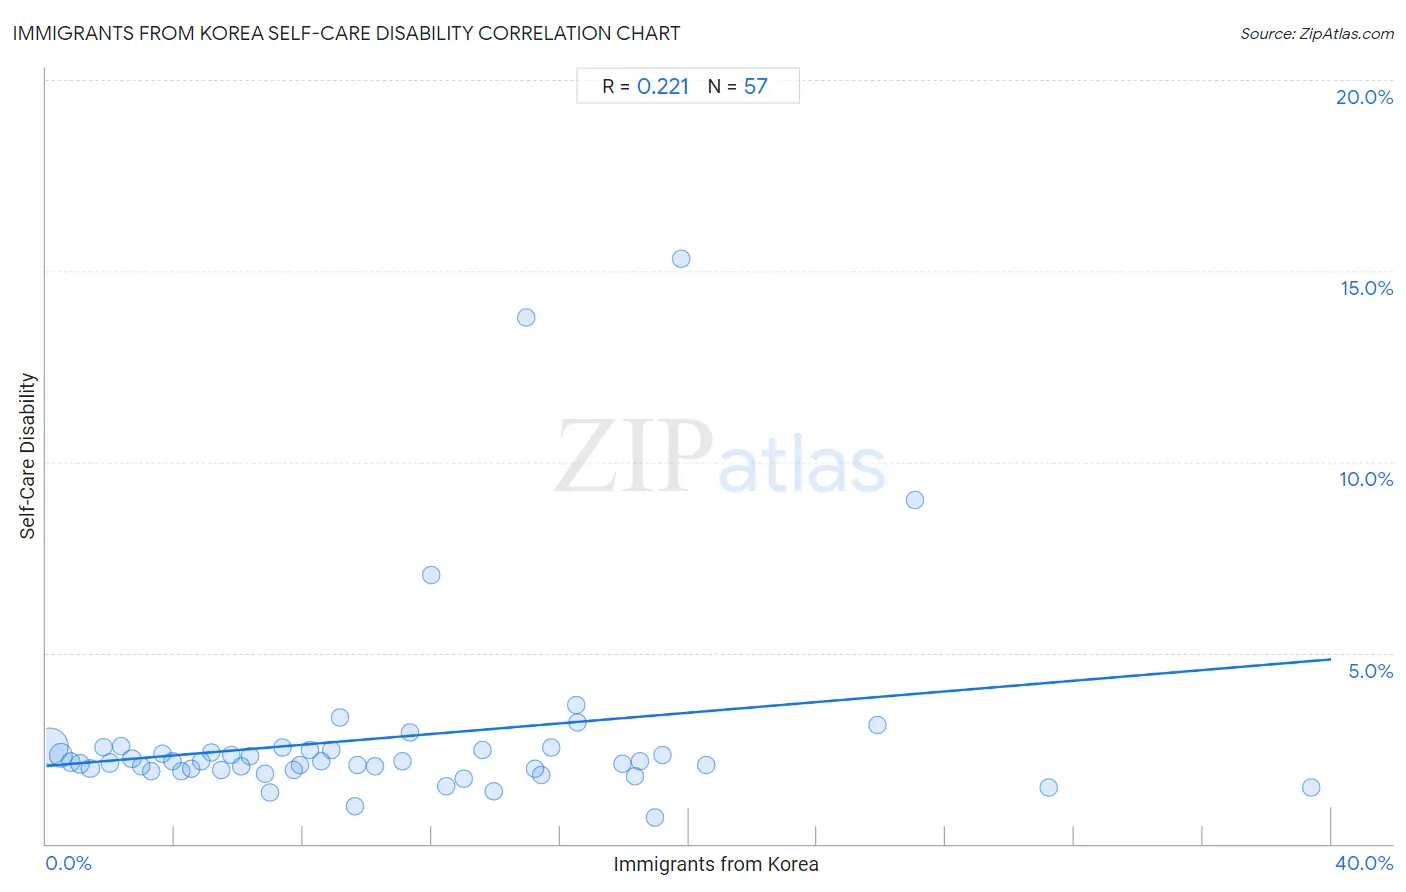
Immigrants from Korea Self-Care Disability Correlation Chart
The statistical analysis conducted on geographies consisting of 415,570,089 people shows a weak positive correlation between the proportion of Immigrants from Korea and percentage of population with self-care disability in the United States with a correlation coefficient (R) of 0.221 and weighted average of 2.3%. On average, for every 1% (one percent) increase in Immigrants from Korea within a typical geography, there is an increase of 0.070% in percentage of population with self-care disability.
It is essential to understand that the correlation between the percentage of Immigrants from Korea and percentage of population with self-care disability does not imply a direct cause-and-effect relationship. It remains uncertain whether the presence of Immigrants from Korea influences an upward or downward trend in the level of percentage of population with self-care disability within an area, or if Immigrants from Korea simply ended up residing in those areas with higher or lower levels of percentage of population with self-care disability due to other factors.
Demographics Similar to Immigrants from Korea by Self-Care Disability
In terms of self-care disability, the demographic groups most similar to Immigrants from Korea are Immigrants from Turkey (2.3%, a difference of 0.060%), Immigrants from Australia (2.3%, a difference of 0.12%), Immigrants from Lithuania (2.3%, a difference of 0.13%), Burmese (2.3%, a difference of 0.23%), and Danish (2.3%, a difference of 0.30%).
| Demographics | Rating | Rank | Self-Care Disability |
| Immigrants from Sri Lanka | 99.9 /100 | #26 | Exceptional 2.2% |
| Venezuelans | 99.9 /100 | #27 | Exceptional 2.2% |
| Inupiat | 99.9 /100 | #28 | Exceptional 2.2% |
| Immigrants from Zimbabwe | 99.9 /100 | #29 | Exceptional 2.3% |
| Paraguayans | 99.9 /100 | #30 | Exceptional 2.3% |
| Danes | 99.9 /100 | #31 | Exceptional 2.3% |
| Burmese | 99.9 /100 | #32 | Exceptional 2.3% |
| Immigrants from Korea | 99.9 /100 | #33 | Exceptional 2.3% |
| Immigrants from Turkey | 99.9 /100 | #34 | Exceptional 2.3% |
| Immigrants from Australia | 99.9 /100 | #35 | Exceptional 2.3% |
| Immigrants from Lithuania | 99.9 /100 | #36 | Exceptional 2.3% |
| Immigrants from Sweden | 99.9 /100 | #37 | Exceptional 2.3% |
| Immigrants from Eastern Africa | 99.9 /100 | #38 | Exceptional 2.3% |
| Immigrants from Bulgaria | 99.8 /100 | #39 | Exceptional 2.3% |
| Iranians | 99.8 /100 | #40 | Exceptional 2.3% |
Immigrants from Korea Self-Care Disability Correlation Summary
| Measurement | Immigrants from Korea Data | Self-Care Disability Data |
| Minimum | 0.13% | 0.68% |
| Maximum | 39.4% | 15.3% |
| Range | 39.3% | 14.6% |
| Mean | 10.7% | 2.8% |
| Median | 8.9% | 2.1% |
| Interquartile 25% (IQ1) | 4.4% | 1.9% |
| Interquartile 75% (IQ3) | 15.6% | 2.5% |
| Interquartile Range (IQR) | 11.2% | 0.57% |
| Standard Deviation (Sample) | 8.2% | 2.6% |
| Standard Deviation (Population) | 8.1% | 2.6% |
Correlation Details
| Immigrants from Korea Percentile | Sample Size | Self-Care Disability |
[ 0.0% - 0.5% ] 0.13% | 262,092,593 | 2.6% |
[ 0.0% - 0.5% ] 0.45% | 78,186,036 | 2.3% |
[ 0.5% - 1.0% ] 0.76% | 29,239,958 | 2.1% |
[ 1.0% - 1.5% ] 1.07% | 15,773,600 | 2.1% |
[ 1.0% - 1.5% ] 1.37% | 7,640,950 | 2.0% |
[ 1.5% - 2.0% ] 1.78% | 7,690,201 | 2.5% |
[ 1.5% - 2.0% ] 1.99% | 3,156,795 | 2.1% |
[ 2.0% - 2.5% ] 2.32% | 1,945,595 | 2.5% |
[ 2.5% - 3.0% ] 2.66% | 1,752,600 | 2.2% |
[ 2.5% - 3.0% ] 2.96% | 1,389,862 | 2.0% |
[ 3.0% - 3.5% ] 3.28% | 951,824 | 1.9% |
[ 3.5% - 4.0% ] 3.60% | 605,067 | 2.3% |
[ 3.5% - 4.0% ] 3.93% | 452,912 | 2.1% |
[ 4.0% - 4.5% ] 4.20% | 479,423 | 1.9% |
[ 4.5% - 5.0% ] 4.51% | 584,702 | 2.0% |
[ 4.5% - 5.0% ] 4.83% | 476,952 | 2.2% |
[ 5.0% - 5.5% ] 5.12% | 203,527 | 2.4% |
[ 5.0% - 5.5% ] 5.45% | 233,308 | 1.9% |
[ 5.5% - 6.0% ] 5.76% | 263,253 | 2.3% |
[ 6.0% - 6.5% ] 6.05% | 184,026 | 2.0% |
[ 6.0% - 6.5% ] 6.33% | 193,480 | 2.3% |
[ 6.5% - 7.0% ] 6.79% | 162,666 | 1.8% |
[ 6.5% - 7.0% ] 6.96% | 87,480 | 1.4% |
[ 7.0% - 7.5% ] 7.37% | 93,669 | 2.5% |
[ 7.5% - 8.0% ] 7.69% | 228,129 | 1.9% |
[ 7.5% - 8.0% ] 7.91% | 170,007 | 2.0% |
[ 8.0% - 8.5% ] 8.21% | 238,163 | 2.5% |
[ 8.5% - 9.0% ] 8.56% | 189,492 | 2.1% |
[ 8.5% - 9.0% ] 8.85% | 147,426 | 2.5% |
[ 9.0% - 9.5% ] 9.16% | 52,383 | 3.3% |
[ 9.5% - 10.0% ] 9.63% | 27,788 | 0.97% |
[ 9.5% - 10.0% ] 9.69% | 98,267 | 2.1% |
[ 10.0% - 10.5% ] 10.25% | 37,735 | 2.0% |
[ 11.0% - 11.5% ] 11.09% | 56,628 | 2.1% |
[ 11.0% - 11.5% ] 11.32% | 4,098 | 2.9% |
[ 11.5% - 12.0% ] 11.98% | 9,273 | 7.0% |
[ 12.0% - 12.5% ] 12.47% | 31,252 | 1.5% |
[ 13.0% - 13.5% ] 13.01% | 10,819 | 1.7% |
[ 13.5% - 14.0% ] 13.57% | 36,151 | 2.4% |
[ 13.5% - 14.0% ] 13.94% | 49,393 | 1.4% |
[ 14.5% - 15.0% ] 14.94% | 87 | 13.8% |
[ 15.0% - 15.5% ] 15.20% | 52,799 | 2.0% |
[ 15.0% - 15.5% ] 15.40% | 5,336 | 1.8% |
[ 15.5% - 16.0% ] 15.71% | 18,210 | 2.5% |
[ 16.0% - 16.5% ] 16.49% | 40,285 | 3.6% |
[ 16.5% - 17.0% ] 16.53% | 44,943 | 3.2% |
[ 17.5% - 18.0% ] 17.93% | 37,754 | 2.1% |
[ 18.0% - 18.5% ] 18.33% | 38,400 | 1.8% |
[ 18.0% - 18.5% ] 18.50% | 18,564 | 2.2% |
[ 18.5% - 19.0% ] 18.97% | 5,863 | 0.68% |
[ 19.0% - 19.5% ] 19.20% | 22,930 | 2.3% |
[ 19.5% - 20.0% ] 19.75% | 1,139 | 15.3% |
[ 20.5% - 21.0% ] 20.56% | 11,314 | 2.1% |
[ 25.5% - 26.0% ] 25.89% | 224 | 3.1% |
[ 27.0% - 27.5% ] 27.03% | 111 | 9.0% |
[ 31.0% - 31.5% ] 31.21% | 4,185 | 1.5% |
[ 39.0% - 39.5% ] 39.39% | 40,462 | 1.5% |