Immigrants from India Disability Age Under 5
COMPARE
Immigrants from India
Select to Compare
Disability Age Under 5
Immigrants from India Disability Age Under 5
1.0%
DISABILITY | AGE UNDER 5
99.9/ 100
METRIC RATING
37th/ 347
METRIC RANK
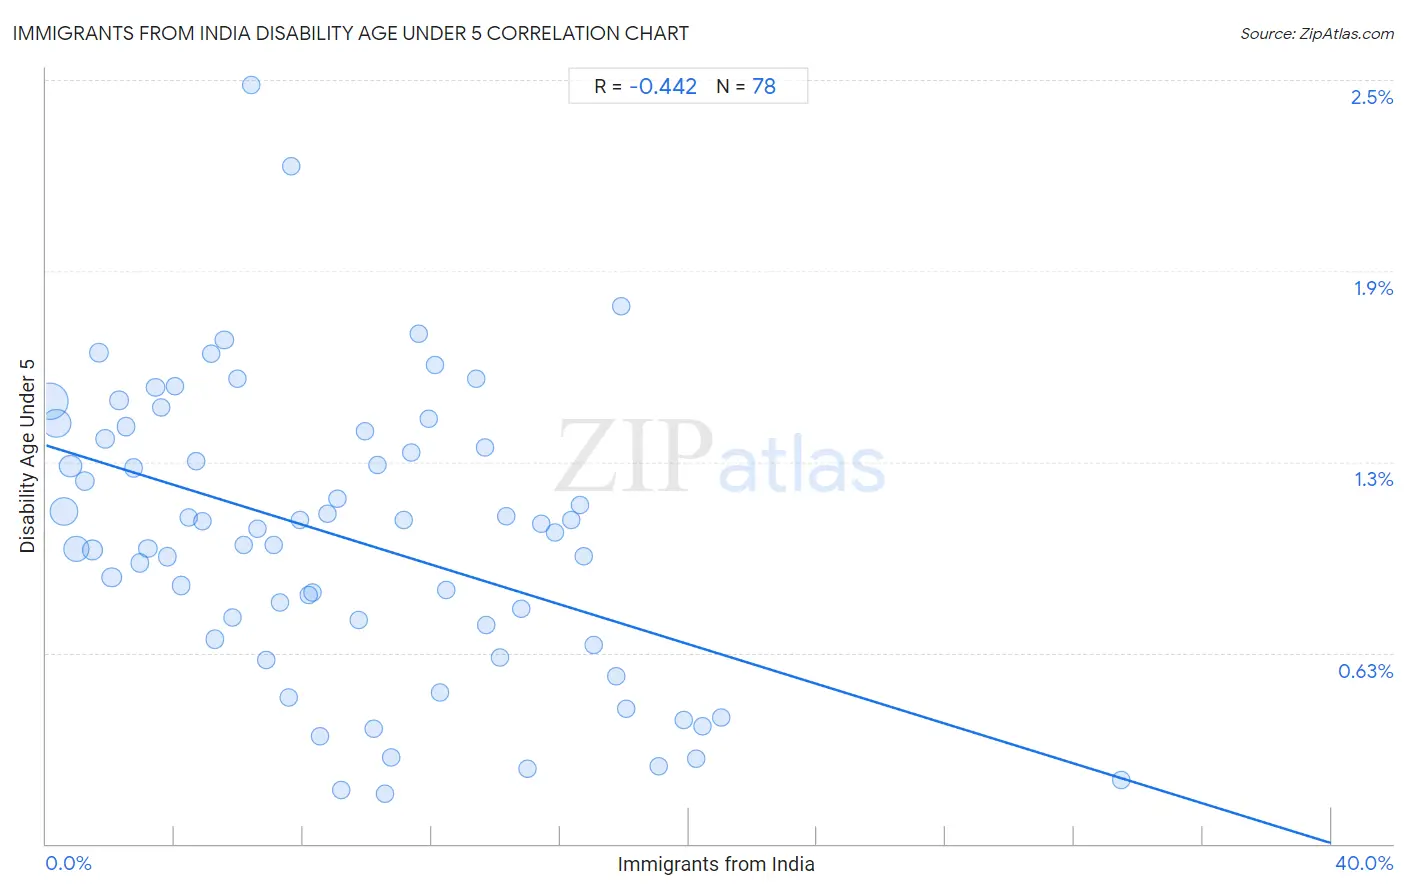
Immigrants from India Disability Age Under 5 Correlation Chart
The statistical analysis conducted on geographies consisting of 228,217,406 people shows a moderate negative correlation between the proportion of Immigrants from India and percentage of population with a disability under the age of 5 in the United States with a correlation coefficient (R) of -0.442 and weighted average of 1.0%. On average, for every 1% (one percent) increase in Immigrants from India within a typical geography, there is a decrease of 0.033% in percentage of population with a disability under the age of 5.
It is essential to understand that the correlation between the percentage of Immigrants from India and percentage of population with a disability under the age of 5 does not imply a direct cause-and-effect relationship. It remains uncertain whether the presence of Immigrants from India influences an upward or downward trend in the level of percentage of population with a disability under the age of 5 within an area, or if Immigrants from India simply ended up residing in those areas with higher or lower levels of percentage of population with a disability under the age of 5 due to other factors.
Demographics Similar to Immigrants from India by Disability Age Under 5
In terms of disability age under 5, the demographic groups most similar to Immigrants from India are Immigrants from Nepal (1.0%, a difference of 0.020%), Immigrants from Guyana (1.0%, a difference of 0.080%), Barbadian (1.0%, a difference of 0.73%), Filipino (1.1%, a difference of 0.76%), and Immigrants from Ukraine (1.0%, a difference of 0.97%).
| Demographics | Rating | Rank | Disability Age Under 5 |
| Immigrants from South Central Asia | 99.9 /100 | #30 | Exceptional 1.0% |
| Armenians | 99.9 /100 | #31 | Exceptional 1.0% |
| Iranians | 99.9 /100 | #32 | Exceptional 1.0% |
| Bolivians | 99.9 /100 | #33 | Exceptional 1.0% |
| Immigrants from Ukraine | 99.9 /100 | #34 | Exceptional 1.0% |
| Barbadians | 99.9 /100 | #35 | Exceptional 1.0% |
| Immigrants from Nepal | 99.9 /100 | #36 | Exceptional 1.0% |
| Immigrants from India | 99.9 /100 | #37 | Exceptional 1.0% |
| Immigrants from Guyana | 99.9 /100 | #38 | Exceptional 1.0% |
| Filipinos | 99.9 /100 | #39 | Exceptional 1.1% |
| Immigrants from Albania | 99.9 /100 | #40 | Exceptional 1.1% |
| Thais | 99.8 /100 | #41 | Exceptional 1.1% |
| Immigrants from Bulgaria | 99.8 /100 | #42 | Exceptional 1.1% |
| Pima | 99.8 /100 | #43 | Exceptional 1.1% |
| Immigrants from Asia | 99.8 /100 | #44 | Exceptional 1.1% |
Immigrants from India Disability Age Under 5 Correlation Summary
| Measurement | Immigrants from India Data | Disability Age Under 5 Data |
| Minimum | 0.11% | 0.16% |
| Maximum | 33.5% | 2.5% |
| Range | 33.4% | 2.3% |
| Mean | 9.3% | 1.00% |
| Median | 8.4% | 1.0% |
| Interquartile 25% (IQ1) | 4.2% | 0.67% |
| Interquartile 75% (IQ3) | 13.7% | 1.3% |
| Interquartile Range (IQR) | 9.5% | 0.66% |
| Standard Deviation (Sample) | 6.4% | 0.47% |
| Standard Deviation (Population) | 6.4% | 0.47% |
Correlation Details
| Immigrants from India Percentile | Sample Size | Disability Age Under 5 |
[ 0.0% - 0.5% ] 0.11% | 66,998,648 | 1.4% |
[ 0.0% - 0.5% ] 0.31% | 38,466,494 | 1.4% |
[ 0.5% - 1.0% ] 0.55% | 34,347,632 | 1.1% |
[ 0.5% - 1.0% ] 0.76% | 14,095,246 | 1.2% |
[ 0.5% - 1.0% ] 0.95% | 25,945,500 | 0.96% |
[ 1.0% - 1.5% ] 1.19% | 5,560,193 | 1.2% |
[ 1.0% - 1.5% ] 1.42% | 9,120,877 | 0.96% |
[ 1.5% - 2.0% ] 1.63% | 3,213,367 | 1.6% |
[ 1.5% - 2.0% ] 1.83% | 3,694,736 | 1.3% |
[ 2.0% - 2.5% ] 2.04% | 5,640,326 | 0.87% |
[ 2.0% - 2.5% ] 2.27% | 1,998,285 | 1.5% |
[ 2.0% - 2.5% ] 2.50% | 1,726,842 | 1.4% |
[ 2.5% - 3.0% ] 2.71% | 1,435,089 | 1.2% |
[ 2.5% - 3.0% ] 2.92% | 1,380,818 | 0.92% |
[ 3.0% - 3.5% ] 3.16% | 1,820,724 | 0.97% |
[ 3.0% - 3.5% ] 3.40% | 642,990 | 1.5% |
[ 3.5% - 4.0% ] 3.56% | 444,944 | 1.4% |
[ 3.5% - 4.0% ] 3.77% | 1,089,708 | 0.94% |
[ 4.0% - 4.5% ] 4.01% | 496,930 | 1.5% |
[ 4.0% - 4.5% ] 4.21% | 805,003 | 0.85% |
[ 4.0% - 4.5% ] 4.45% | 437,099 | 1.1% |
[ 4.5% - 5.0% ] 4.68% | 442,407 | 1.3% |
[ 4.5% - 5.0% ] 4.88% | 241,045 | 1.1% |
[ 5.0% - 5.5% ] 5.12% | 311,188 | 1.6% |
[ 5.0% - 5.5% ] 5.26% | 1,197,922 | 0.67% |
[ 5.5% - 6.0% ] 5.54% | 304,011 | 1.6% |
[ 5.5% - 6.0% ] 5.78% | 80,086 | 0.74% |
[ 5.5% - 6.0% ] 5.96% | 391,462 | 1.5% |
[ 6.0% - 6.5% ] 6.14% | 273,844 | 0.98% |
[ 6.0% - 6.5% ] 6.37% | 195,206 | 2.5% |
[ 6.5% - 7.0% ] 6.56% | 142,620 | 1.0% |
[ 6.5% - 7.0% ] 6.86% | 117,714 | 0.60% |
[ 7.0% - 7.5% ] 7.07% | 291,393 | 0.98% |
[ 7.0% - 7.5% ] 7.27% | 182,324 | 0.79% |
[ 7.5% - 8.0% ] 7.54% | 229,208 | 0.48% |
[ 7.5% - 8.0% ] 7.64% | 107,124 | 2.2% |
[ 7.5% - 8.0% ] 7.90% | 330,338 | 1.1% |
[ 8.0% - 8.5% ] 8.18% | 154,662 | 0.82% |
[ 8.0% - 8.5% ] 8.31% | 183,324 | 0.82% |
[ 8.5% - 9.0% ] 8.50% | 51,107 | 0.35% |
[ 8.5% - 9.0% ] 8.75% | 59,084 | 1.1% |
[ 9.0% - 9.5% ] 9.06% | 301,202 | 1.1% |
[ 9.0% - 9.5% ] 9.18% | 89,204 | 0.17% |
[ 9.5% - 10.0% ] 9.73% | 31,227 | 0.73% |
[ 9.5% - 10.0% ] 9.91% | 113,547 | 1.4% |
[ 10.0% - 10.5% ] 10.19% | 254,962 | 0.38% |
[ 10.0% - 10.5% ] 10.31% | 127,773 | 1.2% |
[ 10.5% - 11.0% ] 10.56% | 150,606 | 0.16% |
[ 10.5% - 11.0% ] 10.75% | 293,693 | 0.28% |
[ 11.0% - 11.5% ] 11.12% | 32,559 | 1.1% |
[ 11.0% - 11.5% ] 11.37% | 66,586 | 1.3% |
[ 11.5% - 12.0% ] 11.58% | 51,281 | 1.7% |
[ 11.5% - 12.0% ] 11.89% | 41,967 | 1.4% |
[ 12.0% - 12.5% ] 12.11% | 45,938 | 1.6% |
[ 12.0% - 12.5% ] 12.27% | 26,805 | 0.50% |
[ 12.0% - 12.5% ] 12.45% | 103,037 | 0.83% |
[ 13.0% - 13.5% ] 13.39% | 104,532 | 1.5% |
[ 13.5% - 14.0% ] 13.66% | 31,026 | 1.3% |
[ 13.5% - 14.0% ] 13.69% | 128,058 | 0.72% |
[ 14.0% - 14.5% ] 14.14% | 154,573 | 0.61% |
[ 14.0% - 14.5% ] 14.34% | 86,119 | 1.1% |
[ 14.5% - 15.0% ] 14.77% | 14,344 | 0.77% |
[ 14.5% - 15.0% ] 14.99% | 51,081 | 0.25% |
[ 15.0% - 15.5% ] 15.43% | 60,499 | 1.0% |
[ 15.5% - 16.0% ] 15.83% | 77,324 | 1.0% |
[ 16.0% - 16.5% ] 16.34% | 73,728 | 1.1% |
[ 16.5% - 17.0% ] 16.61% | 114,385 | 1.1% |
[ 16.5% - 17.0% ] 16.73% | 24,444 | 0.94% |
[ 17.0% - 17.5% ] 17.04% | 158,485 | 0.65% |
[ 17.5% - 18.0% ] 17.74% | 66,046 | 0.55% |
[ 17.5% - 18.0% ] 17.90% | 92,737 | 1.8% |
[ 18.0% - 18.5% ] 18.06% | 71,034 | 0.44% |
[ 19.0% - 19.5% ] 19.06% | 48,140 | 0.25% |
[ 19.5% - 20.0% ] 19.83% | 59,763 | 0.40% |
[ 20.0% - 20.5% ] 20.25% | 295,010 | 0.28% |
[ 20.0% - 20.5% ] 20.44% | 61,414 | 0.38% |
[ 21.0% - 21.5% ] 21.03% | 22,187 | 0.41% |
[ 33.0% - 33.5% ] 33.47% | 44,570 | 0.21% |