Immigrants from India 4 or more Vehicles in Household
COMPARE
Immigrants from India
Select to Compare
4 or more Vehicles in Household
Immigrants from India 4 or more Vehicles in Household
6.3%
4+ VEHICLES AVAILABLE
51.9/ 100
METRIC RATING
171st/ 347
METRIC RANK
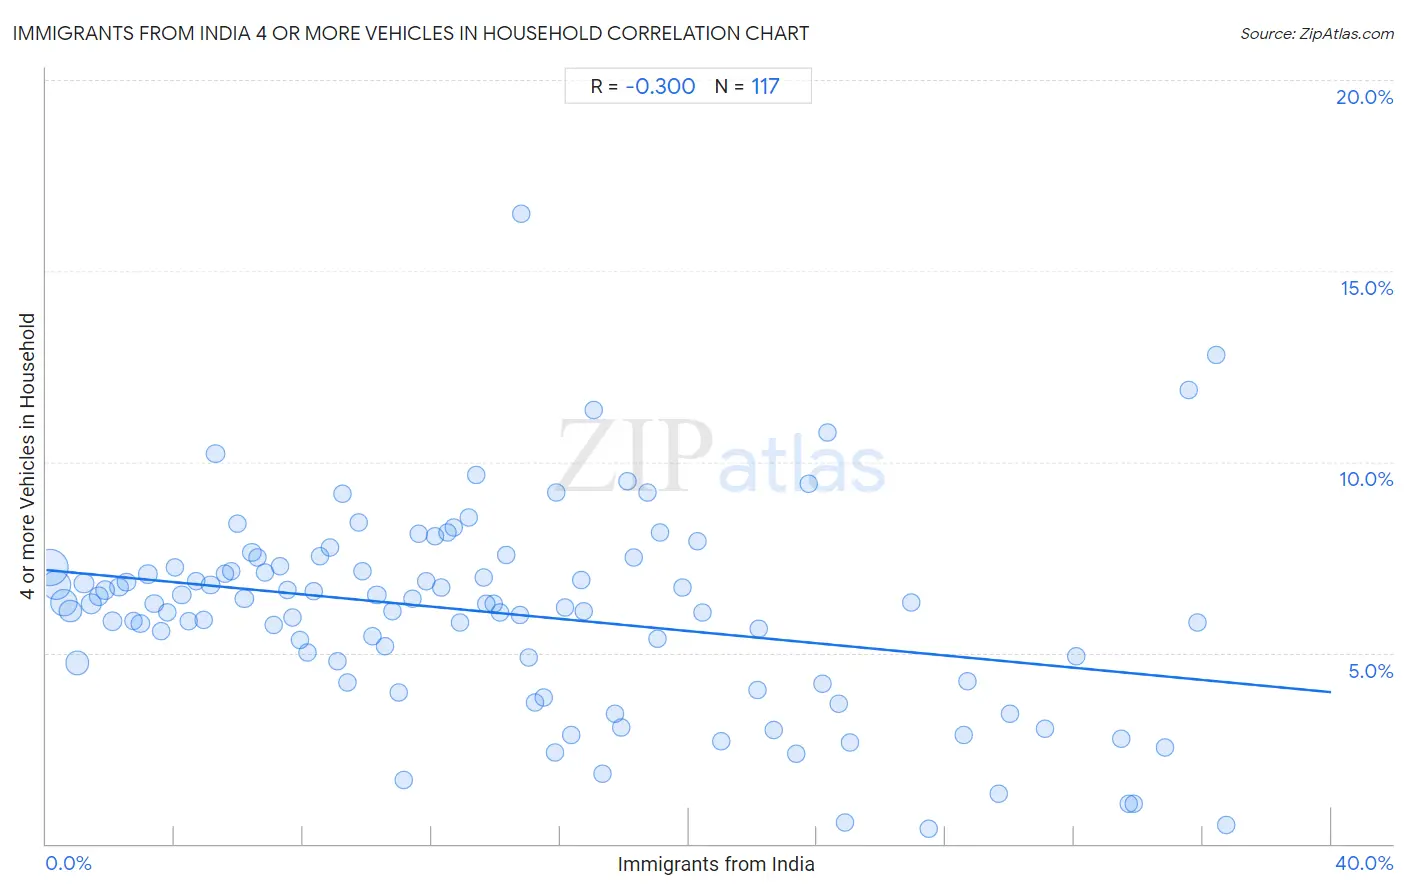
Immigrants from India 4 or more Vehicles in Household Correlation Chart
The statistical analysis conducted on geographies consisting of 431,878,521 people shows a mild negative correlation between the proportion of Immigrants from India and percentage of households with 4 or more vehicles available in the United States with a correlation coefficient (R) of -0.300 and weighted average of 6.3%. On average, for every 1% (one percent) increase in Immigrants from India within a typical geography, there is a decrease of 0.080% in percentage of households with 4 or more vehicles available.
It is essential to understand that the correlation between the percentage of Immigrants from India and percentage of households with 4 or more vehicles available does not imply a direct cause-and-effect relationship. It remains uncertain whether the presence of Immigrants from India influences an upward or downward trend in the level of percentage of households with 4 or more vehicles available within an area, or if Immigrants from India simply ended up residing in those areas with higher or lower levels of percentage of households with 4 or more vehicles available due to other factors.
Demographics Similar to Immigrants from India by 4 or more Vehicles in Household
In terms of 4 or more vehicles in household, the demographic groups most similar to Immigrants from India are Immigrants from Lebanon (6.3%, a difference of 0.020%), Immigrants from Syria (6.3%, a difference of 0.080%), Slovene (6.3%, a difference of 0.080%), Lithuanian (6.3%, a difference of 0.20%), and Estonian (6.4%, a difference of 0.32%).
| Demographics | Rating | Rank | 4 or more Vehicles in Household |
| Hungarians | 61.1 /100 | #164 | Good 6.4% |
| Immigrants from Peru | 59.8 /100 | #165 | Average 6.4% |
| Immigrants from Denmark | 57.8 /100 | #166 | Average 6.4% |
| Poles | 56.9 /100 | #167 | Average 6.4% |
| Lebanese | 55.8 /100 | #168 | Average 6.4% |
| Estonians | 55.1 /100 | #169 | Average 6.4% |
| Immigrants from Syria | 52.8 /100 | #170 | Average 6.3% |
| Immigrants from India | 51.9 /100 | #171 | Average 6.3% |
| Immigrants from Lebanon | 51.7 /100 | #172 | Average 6.3% |
| Slovenes | 51.1 /100 | #173 | Average 6.3% |
| Lithuanians | 50.0 /100 | #174 | Average 6.3% |
| Immigrants from Western Europe | 48.8 /100 | #175 | Average 6.3% |
| Ukrainians | 47.6 /100 | #176 | Average 6.3% |
| Slovaks | 46.9 /100 | #177 | Average 6.3% |
| Belizeans | 44.5 /100 | #178 | Average 6.3% |
Immigrants from India 4 or more Vehicles in Household Correlation Summary
| Measurement | Immigrants from India Data | 4 or more Vehicles in Household Data |
| Minimum | 0.10% | 0.38% |
| Maximum | 36.7% | 16.5% |
| Range | 36.6% | 16.1% |
| Mean | 14.2% | 6.0% |
| Median | 12.7% | 6.3% |
| Interquartile 25% (IQ1) | 6.3% | 4.5% |
| Interquartile 75% (IQ3) | 20.0% | 7.2% |
| Interquartile Range (IQR) | 13.8% | 2.8% |
| Standard Deviation (Sample) | 9.7% | 2.6% |
| Standard Deviation (Population) | 9.7% | 2.6% |
Correlation Details
| Immigrants from India Percentile | Sample Size | 4 or more Vehicles in Household |
[ 0.0% - 0.5% ] 0.10% | 127,392,395 | 7.2% |
[ 0.0% - 0.5% ] 0.32% | 76,267,772 | 6.8% |
[ 0.5% - 1.0% ] 0.54% | 57,379,171 | 6.3% |
[ 0.5% - 1.0% ] 0.75% | 28,792,993 | 6.1% |
[ 0.5% - 1.0% ] 0.96% | 36,884,005 | 4.7% |
[ 1.0% - 1.5% ] 1.19% | 13,679,014 | 6.8% |
[ 1.0% - 1.5% ] 1.42% | 16,277,223 | 6.3% |
[ 1.5% - 2.0% ] 1.62% | 8,330,013 | 6.5% |
[ 1.5% - 2.0% ] 1.84% | 7,149,820 | 6.7% |
[ 2.0% - 2.5% ] 2.04% | 8,608,216 | 5.8% |
[ 2.0% - 2.5% ] 2.26% | 5,040,034 | 6.7% |
[ 2.0% - 2.5% ] 2.49% | 4,570,365 | 6.8% |
[ 2.5% - 3.0% ] 2.72% | 3,983,489 | 5.8% |
[ 2.5% - 3.0% ] 2.93% | 3,180,191 | 5.8% |
[ 3.0% - 3.5% ] 3.16% | 3,426,025 | 7.1% |
[ 3.0% - 3.5% ] 3.36% | 2,001,429 | 6.3% |
[ 3.5% - 4.0% ] 3.58% | 1,691,164 | 5.6% |
[ 3.5% - 4.0% ] 3.78% | 2,303,327 | 6.1% |
[ 4.0% - 4.5% ] 4.01% | 1,259,980 | 7.3% |
[ 4.0% - 4.5% ] 4.22% | 1,652,459 | 6.5% |
[ 4.0% - 4.5% ] 4.43% | 1,045,412 | 5.8% |
[ 4.5% - 5.0% ] 4.67% | 1,193,598 | 6.9% |
[ 4.5% - 5.0% ] 4.88% | 1,084,452 | 5.9% |
[ 5.0% - 5.5% ] 5.12% | 871,846 | 6.8% |
[ 5.0% - 5.5% ] 5.27% | 1,547,032 | 10.2% |
[ 5.5% - 6.0% ] 5.54% | 495,060 | 7.1% |
[ 5.5% - 6.0% ] 5.76% | 505,542 | 7.1% |
[ 5.5% - 6.0% ] 5.96% | 1,020,223 | 8.4% |
[ 6.0% - 6.5% ] 6.17% | 729,902 | 6.4% |
[ 6.0% - 6.5% ] 6.40% | 667,243 | 7.6% |
[ 6.5% - 7.0% ] 6.58% | 560,208 | 7.5% |
[ 6.5% - 7.0% ] 6.82% | 416,873 | 7.1% |
[ 7.0% - 7.5% ] 7.06% | 453,612 | 5.7% |
[ 7.0% - 7.5% ] 7.28% | 396,984 | 7.3% |
[ 7.5% - 8.0% ] 7.50% | 522,512 | 6.7% |
[ 7.5% - 8.0% ] 7.65% | 223,479 | 5.9% |
[ 7.5% - 8.0% ] 7.91% | 600,455 | 5.3% |
[ 8.0% - 8.5% ] 8.15% | 348,568 | 5.0% |
[ 8.0% - 8.5% ] 8.32% | 289,330 | 6.6% |
[ 8.5% - 9.0% ] 8.54% | 321,576 | 7.5% |
[ 8.5% - 9.0% ] 8.82% | 299,483 | 7.8% |
[ 9.0% - 9.5% ] 9.05% | 411,483 | 4.8% |
[ 9.0% - 9.5% ] 9.22% | 256,881 | 9.2% |
[ 9.0% - 9.5% ] 9.39% | 511,894 | 4.2% |
[ 9.5% - 10.0% ] 9.71% | 426,617 | 8.4% |
[ 9.5% - 10.0% ] 9.85% | 315,856 | 7.1% |
[ 10.0% - 10.5% ] 10.15% | 437,971 | 5.4% |
[ 10.0% - 10.5% ] 10.29% | 279,635 | 6.5% |
[ 10.5% - 11.0% ] 10.54% | 331,090 | 5.2% |
[ 10.5% - 11.0% ] 10.76% | 620,284 | 6.1% |
[ 10.5% - 11.0% ] 10.99% | 98,434 | 4.0% |
[ 11.0% - 11.5% ] 11.13% | 104,054 | 1.7% |
[ 11.0% - 11.5% ] 11.40% | 339,283 | 6.4% |
[ 11.5% - 12.0% ] 11.60% | 194,727 | 8.1% |
[ 11.5% - 12.0% ] 11.83% | 190,915 | 6.9% |
[ 12.0% - 12.5% ] 12.11% | 47,175 | 8.0% |
[ 12.0% - 12.5% ] 12.31% | 82,318 | 6.7% |
[ 12.0% - 12.5% ] 12.48% | 145,453 | 8.1% |
[ 12.5% - 13.0% ] 12.67% | 122,114 | 8.3% |
[ 12.5% - 13.0% ] 12.88% | 63,193 | 5.8% |
[ 13.0% - 13.5% ] 13.14% | 66,157 | 8.5% |
[ 13.0% - 13.5% ] 13.39% | 105,737 | 9.7% |
[ 13.5% - 14.0% ] 13.61% | 136,078 | 7.0% |
[ 13.5% - 14.0% ] 13.70% | 131,525 | 6.3% |
[ 13.5% - 14.0% ] 13.94% | 83,315 | 6.3% |
[ 14.0% - 14.5% ] 14.13% | 159,918 | 6.1% |
[ 14.0% - 14.5% ] 14.34% | 86,119 | 7.6% |
[ 14.5% - 15.0% ] 14.73% | 47,719 | 6.0% |
[ 14.5% - 15.0% ] 14.78% | 14,658 | 16.5% |
[ 15.0% - 15.5% ] 15.00% | 204,934 | 4.9% |
[ 15.0% - 15.5% ] 15.21% | 22,030 | 3.7% |
[ 15.5% - 16.0% ] 15.50% | 118,050 | 3.8% |
[ 15.5% - 16.0% ] 15.82% | 82,393 | 2.4% |
[ 15.5% - 16.0% ] 15.89% | 4,960 | 9.2% |
[ 16.0% - 16.5% ] 16.13% | 35,507 | 6.2% |
[ 16.0% - 16.5% ] 16.33% | 93,461 | 2.8% |
[ 16.5% - 17.0% ] 16.65% | 256,521 | 6.9% |
[ 16.5% - 17.0% ] 16.73% | 24,444 | 6.1% |
[ 17.0% - 17.5% ] 17.04% | 158,485 | 11.4% |
[ 17.0% - 17.5% ] 17.31% | 15,571 | 1.8% |
[ 17.5% - 18.0% ] 17.71% | 86,266 | 3.4% |
[ 17.5% - 18.0% ] 17.90% | 98,975 | 3.1% |
[ 18.0% - 18.5% ] 18.09% | 140,890 | 9.5% |
[ 18.0% - 18.5% ] 18.31% | 14,345 | 7.5% |
[ 18.5% - 19.0% ] 18.72% | 219 | 9.2% |
[ 19.0% - 19.5% ] 19.04% | 124,761 | 5.4% |
[ 19.0% - 19.5% ] 19.10% | 11,603 | 8.2% |
[ 19.5% - 20.0% ] 19.82% | 79,891 | 6.7% |
[ 20.0% - 20.5% ] 20.26% | 316,805 | 7.9% |
[ 20.0% - 20.5% ] 20.44% | 61,414 | 6.1% |
[ 21.0% - 21.5% ] 21.02% | 55,440 | 2.7% |
[ 22.0% - 22.5% ] 22.12% | 22,796 | 4.0% |
[ 22.0% - 22.5% ] 22.19% | 89,256 | 5.6% |
[ 22.5% - 23.0% ] 22.63% | 38,567 | 3.0% |
[ 23.0% - 23.5% ] 23.35% | 27,571 | 2.4% |
[ 23.5% - 24.0% ] 23.73% | 53,464 | 9.4% |
[ 24.0% - 24.5% ] 24.16% | 21,806 | 4.2% |
[ 24.0% - 24.5% ] 24.34% | 5,206 | 10.8% |
[ 24.5% - 25.0% ] 24.65% | 20,954 | 3.7% |
[ 24.5% - 25.0% ] 24.87% | 599 | 0.55% |
[ 25.0% - 25.5% ] 25.02% | 44,439 | 2.6% |
[ 26.5% - 27.0% ] 26.93% | 18,068 | 6.3% |
[ 27.0% - 27.5% ] 27.46% | 5,018 | 0.38% |
[ 28.5% - 29.0% ] 28.55% | 802 | 2.9% |
[ 28.5% - 29.0% ] 28.69% | 3,879 | 4.3% |
[ 29.5% - 30.0% ] 29.66% | 5,867 | 1.3% |
[ 29.5% - 30.0% ] 29.99% | 64,161 | 3.4% |
[ 31.0% - 31.5% ] 31.09% | 341 | 3.0% |
[ 32.0% - 32.5% ] 32.07% | 10,514 | 4.9% |
[ 33.0% - 33.5% ] 33.47% | 44,570 | 2.7% |
[ 33.5% - 34.0% ] 33.70% | 22,993 | 1.0% |
[ 33.5% - 34.0% ] 33.85% | 15,585 | 1.1% |
[ 34.5% - 35.0% ] 34.84% | 37,022 | 2.5% |
[ 35.5% - 36.0% ] 35.56% | 1,049 | 11.9% |
[ 35.5% - 36.0% ] 35.84% | 39,565 | 5.8% |
[ 36.0% - 36.5% ] 36.41% | 2,387 | 12.8% |
[ 36.5% - 37.0% ] 36.72% | 1,999 | 0.50% |