Immigrants from India Wage/Income Gap
COMPARE
Immigrants from India
Select to Compare
Wage/Income Gap
Immigrants from India Wage/Income Gap
31.5%
WAGE/INCOME GAP
0.0/ 100
METRIC RATING
345th/ 347
METRIC RANK
Immigrants from India Wage/Income Gap Correlation Chart
The statistical analysis conducted on geographies consisting of 433,863,645 people shows a mild positive correlation between the proportion of Immigrants from India and wage/income gap percentage in the United States with a correlation coefficient (R) of 0.338 and weighted average of 31.5%. On average, for every 1% (one percent) increase in Immigrants from India within a typical geography, there is an increase of 0.29% in wage/income gap percentage.
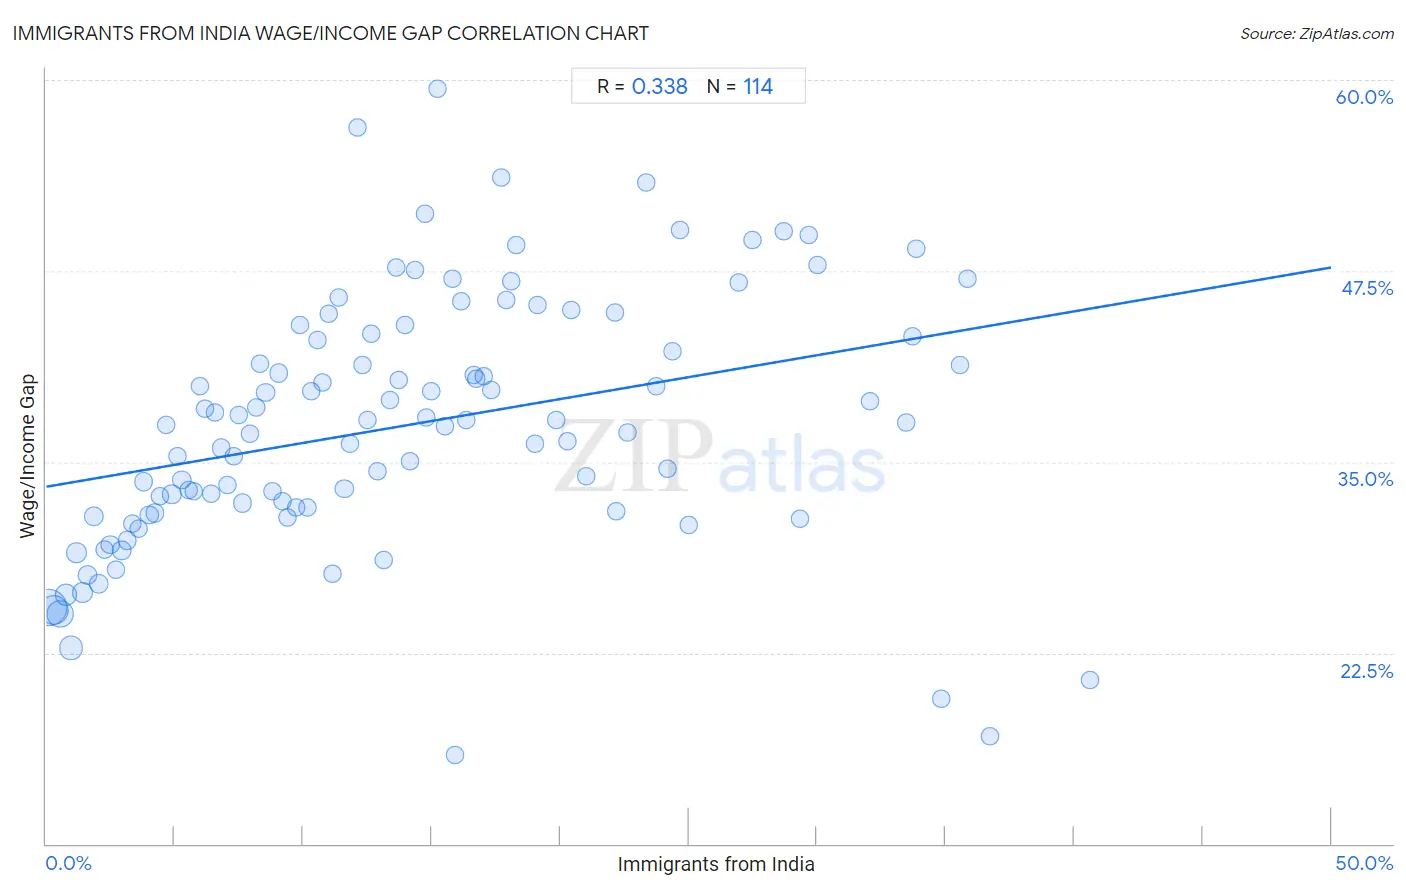
It is essential to understand that the correlation between the percentage of Immigrants from India and wage/income gap percentage does not imply a direct cause-and-effect relationship. It remains uncertain whether the presence of Immigrants from India influences an upward or downward trend in the level of wage/income gap percentage within an area, or if Immigrants from India simply ended up residing in those areas with higher or lower levels of wage/income gap percentage due to other factors.
Demographics Similar to Immigrants from India by Wage/Income Gap
In terms of wage/income gap, the demographic groups most similar to Immigrants from India are Assyrian/Chaldean/Syriac (31.0%, a difference of 1.7%), Danish (31.0%, a difference of 1.8%), Pennsylvania German (30.7%, a difference of 2.7%), Thai (30.5%, a difference of 3.5%), and Swiss (30.0%, a difference of 5.2%).
| Demographics | Rating | Rank | Wage/Income Gap |
| Europeans | 0.0 /100 | #333 | Tragic 29.4% |
| Swedes | 0.0 /100 | #334 | Tragic 29.4% |
| Immigrants from Taiwan | 0.0 /100 | #335 | Tragic 29.5% |
| English | 0.0 /100 | #336 | Tragic 29.5% |
| Dutch | 0.0 /100 | #337 | Tragic 29.6% |
| Filipinos | 0.0 /100 | #338 | Tragic 29.7% |
| Iranians | 0.0 /100 | #339 | Tragic 29.7% |
| Swiss | 0.0 /100 | #340 | Tragic 30.0% |
| Thais | 0.0 /100 | #341 | Tragic 30.5% |
| Pennsylvania Germans | 0.0 /100 | #342 | Tragic 30.7% |
| Danes | 0.0 /100 | #343 | Tragic 31.0% |
| Assyrians/Chaldeans/Syriacs | 0.0 /100 | #344 | Tragic 31.0% |
| Immigrants from India | 0.0 /100 | #345 | Tragic 31.5% |
| Cajuns | 0.0 /100 | #346 | Tragic 33.9% |
| Houma | 0.0 /100 | #347 | Tragic 38.7% |
Immigrants from India Wage/Income Gap Correlation Summary
| Measurement | Immigrants from India Data | Wage/Income Gap Data |
| Minimum | 0.10% | 15.8% |
| Maximum | 40.6% | 59.4% |
| Range | 40.5% | 43.7% |
| Mean | 13.9% | 37.4% |
| Median | 12.4% | 37.5% |
| Interquartile 25% (IQ1) | 6.2% | 31.8% |
| Interquartile 75% (IQ3) | 19.1% | 43.3% |
| Interquartile Range (IQR) | 12.9% | 11.5% |
| Standard Deviation (Sample) | 9.8% | 8.3% |
| Standard Deviation (Population) | 9.7% | 8.3% |
Correlation Details
| Immigrants from India Percentile | Sample Size | Wage/Income Gap |
[ 0.0% - 0.5% ] 0.10% | 127,811,326 | 25.5% |
[ 0.0% - 0.5% ] 0.32% | 76,573,822 | 25.3% |
[ 0.5% - 1.0% ] 0.54% | 57,711,241 | 25.0% |
[ 0.5% - 1.0% ] 0.75% | 28,915,465 | 26.3% |
[ 0.5% - 1.0% ] 0.96% | 36,966,796 | 22.8% |
[ 1.0% - 1.5% ] 1.19% | 13,756,245 | 29.0% |
[ 1.0% - 1.5% ] 1.42% | 16,395,211 | 26.5% |
[ 1.5% - 2.0% ] 1.62% | 8,358,934 | 27.6% |
[ 1.5% - 2.0% ] 1.84% | 7,231,562 | 31.4% |
[ 2.0% - 2.5% ] 2.04% | 8,639,298 | 27.0% |
[ 2.0% - 2.5% ] 2.26% | 5,118,725 | 29.3% |
[ 2.0% - 2.5% ] 2.49% | 4,596,717 | 29.6% |
[ 2.5% - 3.0% ] 2.72% | 4,008,455 | 27.9% |
[ 2.5% - 3.0% ] 2.93% | 3,210,968 | 29.2% |
[ 3.0% - 3.5% ] 3.16% | 3,426,302 | 29.9% |
[ 3.0% - 3.5% ] 3.36% | 2,009,552 | 31.0% |
[ 3.5% - 4.0% ] 3.58% | 1,715,767 | 30.6% |
[ 3.5% - 4.0% ] 3.78% | 2,393,009 | 33.7% |
[ 4.0% - 4.5% ] 4.01% | 1,257,705 | 31.5% |
[ 4.0% - 4.5% ] 4.22% | 1,653,899 | 31.7% |
[ 4.0% - 4.5% ] 4.43% | 1,044,491 | 32.7% |
[ 4.5% - 5.0% ] 4.67% | 1,201,266 | 37.4% |
[ 4.5% - 5.0% ] 4.88% | 1,085,174 | 32.9% |
[ 5.0% - 5.5% ] 5.12% | 872,385 | 35.3% |
[ 5.0% - 5.5% ] 5.27% | 1,547,032 | 33.8% |
[ 5.5% - 6.0% ] 5.54% | 504,727 | 33.2% |
[ 5.5% - 6.0% ] 5.76% | 504,700 | 33.1% |
[ 5.5% - 6.0% ] 5.96% | 1,025,363 | 39.9% |
[ 6.0% - 6.5% ] 6.17% | 729,902 | 38.5% |
[ 6.0% - 6.5% ] 6.40% | 681,512 | 32.9% |
[ 6.5% - 7.0% ] 6.58% | 558,431 | 38.2% |
[ 6.5% - 7.0% ] 6.82% | 442,233 | 35.9% |
[ 7.0% - 7.5% ] 7.06% | 453,612 | 33.5% |
[ 7.0% - 7.5% ] 7.28% | 396,984 | 35.4% |
[ 7.5% - 8.0% ] 7.50% | 522,217 | 38.1% |
[ 7.5% - 8.0% ] 7.66% | 226,339 | 32.3% |
[ 7.5% - 8.0% ] 7.91% | 600,455 | 36.9% |
[ 8.0% - 8.5% ] 8.15% | 348,568 | 38.6% |
[ 8.0% - 8.5% ] 8.32% | 289,330 | 41.4% |
[ 8.5% - 9.0% ] 8.54% | 325,799 | 39.5% |
[ 8.5% - 9.0% ] 8.82% | 299,483 | 33.1% |
[ 9.0% - 9.5% ] 9.05% | 410,865 | 40.8% |
[ 9.0% - 9.5% ] 9.22% | 256,881 | 32.4% |
[ 9.0% - 9.5% ] 9.39% | 511,901 | 31.4% |
[ 9.5% - 10.0% ] 9.71% | 426,617 | 32.0% |
[ 9.5% - 10.0% ] 9.85% | 315,856 | 44.0% |
[ 10.0% - 10.5% ] 10.15% | 437,971 | 32.0% |
[ 10.0% - 10.5% ] 10.29% | 279,635 | 39.6% |
[ 10.5% - 11.0% ] 10.54% | 331,090 | 43.0% |
[ 10.5% - 11.0% ] 10.76% | 624,562 | 40.2% |
[ 10.5% - 11.0% ] 10.99% | 98,434 | 44.7% |
[ 11.0% - 11.5% ] 11.13% | 104,054 | 27.7% |
[ 11.0% - 11.5% ] 11.40% | 339,283 | 45.8% |
[ 11.5% - 12.0% ] 11.60% | 196,749 | 33.2% |
[ 11.5% - 12.0% ] 11.83% | 190,915 | 36.2% |
[ 12.0% - 12.5% ] 12.11% | 47,175 | 56.9% |
[ 12.0% - 12.5% ] 12.31% | 82,318 | 41.3% |
[ 12.0% - 12.5% ] 12.49% | 168,347 | 37.8% |
[ 12.5% - 13.0% ] 12.67% | 122,114 | 43.4% |
[ 12.5% - 13.0% ] 12.88% | 63,193 | 34.4% |
[ 13.0% - 13.5% ] 13.14% | 66,157 | 28.6% |
[ 13.0% - 13.5% ] 13.39% | 104,532 | 39.1% |
[ 13.5% - 14.0% ] 13.61% | 136,078 | 47.7% |
[ 13.5% - 14.0% ] 13.70% | 131,293 | 40.4% |
[ 13.5% - 14.0% ] 13.94% | 83,315 | 43.9% |
[ 14.0% - 14.5% ] 14.14% | 161,058 | 35.0% |
[ 14.0% - 14.5% ] 14.34% | 88,280 | 47.5% |
[ 14.5% - 15.0% ] 14.73% | 47,719 | 51.2% |
[ 14.5% - 15.0% ] 14.78% | 14,658 | 37.9% |
[ 15.0% - 15.5% ] 15.00% | 204,934 | 39.7% |
[ 15.0% - 15.5% ] 15.21% | 22,030 | 59.4% |
[ 15.5% - 16.0% ] 15.50% | 118,050 | 37.4% |
[ 15.5% - 16.0% ] 15.82% | 84,812 | 47.0% |
[ 15.5% - 16.0% ] 15.89% | 4,960 | 15.8% |
[ 16.0% - 16.5% ] 16.13% | 35,162 | 45.5% |
[ 16.0% - 16.5% ] 16.33% | 93,461 | 37.7% |
[ 16.5% - 17.0% ] 16.65% | 256,521 | 40.7% |
[ 16.5% - 17.0% ] 16.73% | 24,444 | 40.5% |
[ 17.0% - 17.5% ] 17.04% | 158,485 | 40.6% |
[ 17.0% - 17.5% ] 17.31% | 15,571 | 39.7% |
[ 17.5% - 18.0% ] 17.71% | 86,266 | 53.6% |
[ 17.5% - 18.0% ] 17.90% | 98,975 | 45.6% |
[ 18.0% - 18.5% ] 18.09% | 140,890 | 46.8% |
[ 18.0% - 18.5% ] 18.31% | 14,345 | 49.2% |
[ 19.0% - 19.5% ] 19.04% | 124,761 | 36.2% |
[ 19.0% - 19.5% ] 19.10% | 11,603 | 45.3% |
[ 19.5% - 20.0% ] 19.82% | 79,891 | 37.7% |
[ 20.0% - 20.5% ] 20.26% | 316,805 | 36.3% |
[ 20.0% - 20.5% ] 20.44% | 61,414 | 44.9% |
[ 21.0% - 21.5% ] 21.02% | 55,440 | 34.1% |
[ 22.0% - 22.5% ] 22.12% | 22,796 | 44.8% |
[ 22.0% - 22.5% ] 22.19% | 89,256 | 31.8% |
[ 22.5% - 23.0% ] 22.63% | 38,567 | 36.9% |
[ 23.0% - 23.5% ] 23.35% | 27,571 | 53.3% |
[ 23.5% - 24.0% ] 23.73% | 53,464 | 40.0% |
[ 24.0% - 24.5% ] 24.16% | 21,806 | 34.6% |
[ 24.0% - 24.5% ] 24.39% | 7,972 | 42.2% |
[ 24.5% - 25.0% ] 24.65% | 20,954 | 50.2% |
[ 25.0% - 25.5% ] 25.02% | 44,439 | 30.9% |
[ 26.5% - 27.0% ] 26.93% | 18,068 | 46.8% |
[ 27.0% - 27.5% ] 27.46% | 5,018 | 49.5% |
[ 28.5% - 29.0% ] 28.69% | 3,695 | 50.1% |
[ 29.0% - 29.5% ] 29.34% | 2,560 | 31.3% |
[ 29.5% - 30.0% ] 29.66% | 5,867 | 49.9% |
[ 29.5% - 30.0% ] 29.99% | 64,161 | 47.8% |
[ 32.0% - 32.5% ] 32.07% | 10,514 | 39.0% |
[ 33.0% - 33.5% ] 33.47% | 44,570 | 37.6% |
[ 33.5% - 34.0% ] 33.70% | 22,993 | 43.3% |
[ 33.5% - 34.0% ] 33.85% | 15,585 | 48.9% |
[ 34.5% - 35.0% ] 34.84% | 37,755 | 19.5% |
[ 35.5% - 36.0% ] 35.56% | 1,049 | 41.3% |
[ 35.5% - 36.0% ] 35.84% | 39,565 | 47.0% |
[ 36.5% - 37.0% ] 36.72% | 1,999 | 17.0% |
[ 40.5% - 41.0% ] 40.60% | 2,549 | 20.7% |