Immigrants from India Self-Care Disability
COMPARE
Immigrants from India
Select to Compare
Self-Care Disability
Immigrants from India Self-Care Disability
2.0%
SELF-CARE DISABILITY
100.0/ 100
METRIC RATING
2nd/ 347
METRIC RANK
Immigrants from India Self-Care Disability Correlation Chart
The statistical analysis conducted on geographies consisting of 433,462,707 people shows a mild negative correlation between the proportion of Immigrants from India and percentage of population with self-care disability in the United States with a correlation coefficient (R) of -0.315 and weighted average of 2.0%. On average, for every 1% (one percent) increase in Immigrants from India within a typical geography, there is a decrease of 0.017% in percentage of population with self-care disability.
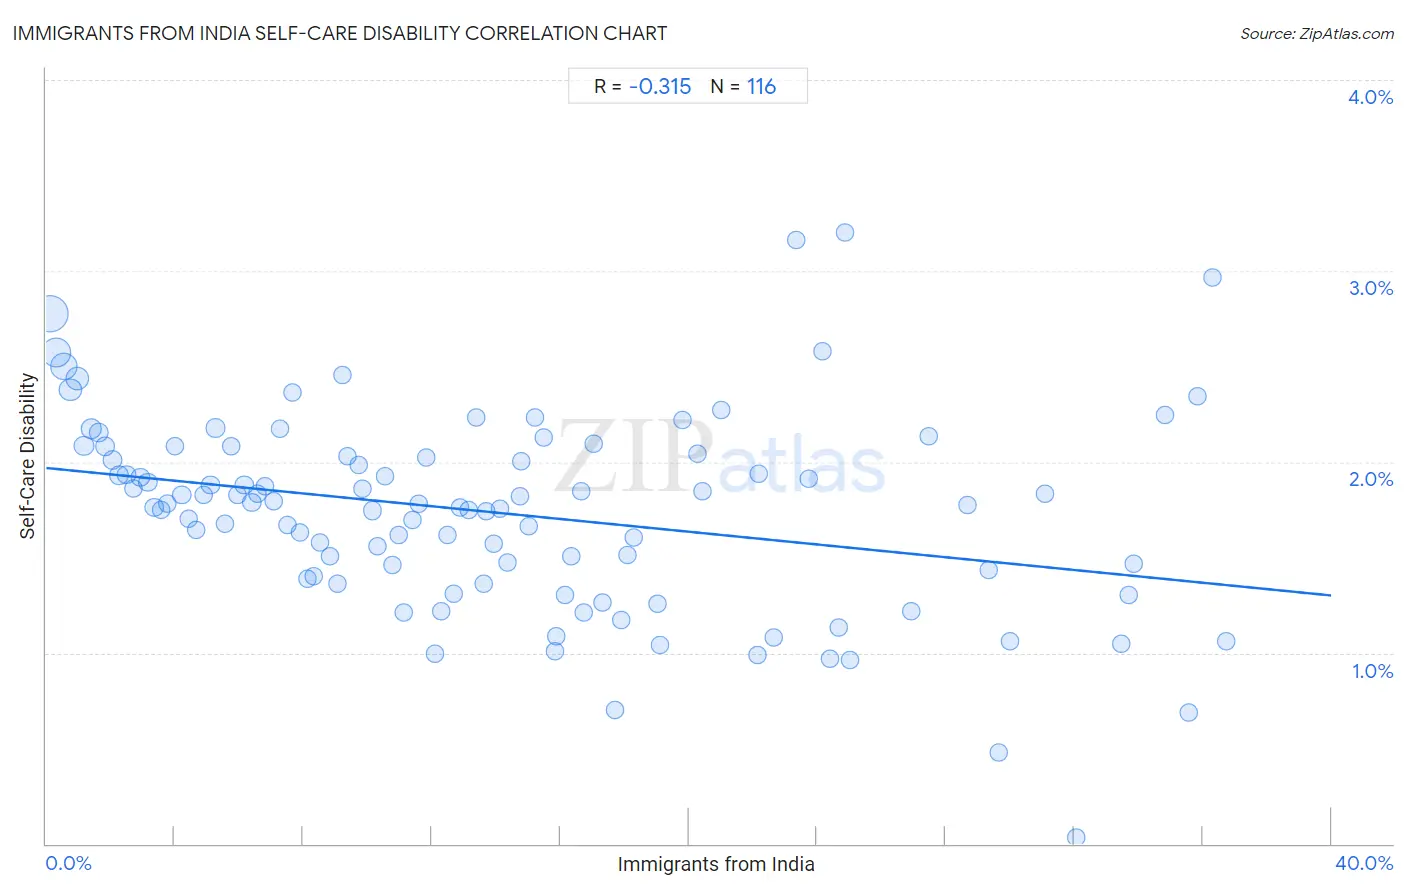
It is essential to understand that the correlation between the percentage of Immigrants from India and percentage of population with self-care disability does not imply a direct cause-and-effect relationship. It remains uncertain whether the presence of Immigrants from India influences an upward or downward trend in the level of percentage of population with self-care disability within an area, or if Immigrants from India simply ended up residing in those areas with higher or lower levels of percentage of population with self-care disability due to other factors.
Demographics Similar to Immigrants from India by Self-Care Disability
In terms of self-care disability, the demographic groups most similar to Immigrants from India are Thai (2.1%, a difference of 3.0%), Immigrants from Singapore (2.1%, a difference of 5.4%), Zimbabwean (2.2%, a difference of 6.5%), Filipino (2.2%, a difference of 6.7%), and Immigrants from Bolivia (2.2%, a difference of 6.9%).
| Demographics | Rating | Rank | Self-Care Disability |
| Yup'ik | 100.0 /100 | #1 | Exceptional 1.9% |
| Immigrants from India | 100.0 /100 | #2 | Exceptional 2.0% |
| Thais | 100.0 /100 | #3 | Exceptional 2.1% |
| Immigrants from Singapore | 100.0 /100 | #4 | Exceptional 2.1% |
| Zimbabweans | 100.0 /100 | #5 | Exceptional 2.2% |
| Filipinos | 100.0 /100 | #6 | Exceptional 2.2% |
| Immigrants from Bolivia | 100.0 /100 | #7 | Exceptional 2.2% |
| Bolivians | 100.0 /100 | #8 | Exceptional 2.2% |
| Immigrants from Nepal | 100.0 /100 | #9 | Exceptional 2.2% |
| Sudanese | 100.0 /100 | #10 | Exceptional 2.2% |
| Immigrants from South Central Asia | 100.0 /100 | #11 | Exceptional 2.2% |
| Immigrants from Ethiopia | 100.0 /100 | #12 | Exceptional 2.2% |
| Ethiopians | 100.0 /100 | #13 | Exceptional 2.2% |
| Luxembourgers | 100.0 /100 | #14 | Exceptional 2.2% |
| Okinawans | 100.0 /100 | #15 | Exceptional 2.2% |
Immigrants from India Self-Care Disability Correlation Summary
| Measurement | Immigrants from India Data | Self-Care Disability Data |
| Minimum | 0.10% | 0.030% |
| Maximum | 36.7% | 3.2% |
| Range | 36.6% | 3.2% |
| Mean | 14.1% | 1.7% |
| Median | 12.6% | 1.8% |
| Interquartile 25% (IQ1) | 6.3% | 1.4% |
| Interquartile 75% (IQ3) | 20.0% | 2.0% |
| Interquartile Range (IQR) | 13.8% | 0.64% |
| Standard Deviation (Sample) | 9.8% | 0.52% |
| Standard Deviation (Population) | 9.7% | 0.52% |
Correlation Details
| Immigrants from India Percentile | Sample Size | Self-Care Disability |
[ 0.0% - 0.5% ] 0.10% | 127,732,703 | 2.8% |
[ 0.0% - 0.5% ] 0.32% | 76,516,685 | 2.6% |
[ 0.5% - 1.0% ] 0.54% | 57,688,779 | 2.5% |
[ 0.5% - 1.0% ] 0.75% | 28,871,780 | 2.4% |
[ 0.5% - 1.0% ] 0.96% | 36,931,335 | 2.4% |
[ 1.0% - 1.5% ] 1.18% | 13,725,390 | 2.1% |
[ 1.0% - 1.5% ] 1.42% | 16,367,537 | 2.2% |
[ 1.5% - 2.0% ] 1.62% | 8,334,797 | 2.2% |
[ 1.5% - 2.0% ] 1.84% | 7,229,552 | 2.1% |
[ 2.0% - 2.5% ] 2.04% | 8,630,053 | 2.0% |
[ 2.0% - 2.5% ] 2.26% | 5,106,128 | 1.9% |
[ 2.0% - 2.5% ] 2.49% | 4,592,276 | 1.9% |
[ 2.5% - 3.0% ] 2.72% | 3,998,877 | 1.9% |
[ 2.5% - 3.0% ] 2.93% | 3,219,620 | 1.9% |
[ 3.0% - 3.5% ] 3.16% | 3,415,053 | 1.9% |
[ 3.0% - 3.5% ] 3.36% | 2,006,836 | 1.8% |
[ 3.5% - 4.0% ] 3.58% | 1,709,544 | 1.7% |
[ 3.5% - 4.0% ] 3.78% | 2,393,415 | 1.8% |
[ 4.0% - 4.5% ] 4.01% | 1,260,042 | 2.1% |
[ 4.0% - 4.5% ] 4.22% | 1,652,571 | 1.8% |
[ 4.0% - 4.5% ] 4.43% | 1,045,573 | 1.7% |
[ 4.5% - 5.0% ] 4.67% | 1,200,996 | 1.6% |
[ 4.5% - 5.0% ] 4.88% | 1,085,174 | 1.8% |
[ 5.0% - 5.5% ] 5.12% | 871,591 | 1.9% |
[ 5.0% - 5.5% ] 5.27% | 1,547,032 | 2.2% |
[ 5.5% - 6.0% ] 5.55% | 497,666 | 1.7% |
[ 5.5% - 6.0% ] 5.76% | 505,757 | 2.1% |
[ 5.5% - 6.0% ] 5.96% | 1,022,153 | 1.8% |
[ 6.0% - 6.5% ] 6.17% | 729,902 | 1.9% |
[ 6.0% - 6.5% ] 6.40% | 679,477 | 1.8% |
[ 6.5% - 7.0% ] 6.58% | 562,363 | 1.8% |
[ 6.5% - 7.0% ] 6.82% | 443,480 | 1.9% |
[ 7.0% - 7.5% ] 7.06% | 452,778 | 1.8% |
[ 7.0% - 7.5% ] 7.28% | 391,221 | 2.2% |
[ 7.5% - 8.0% ] 7.50% | 520,511 | 1.7% |
[ 7.5% - 8.0% ] 7.66% | 226,707 | 2.4% |
[ 7.5% - 8.0% ] 7.91% | 600,455 | 1.6% |
[ 8.0% - 8.5% ] 8.15% | 348,568 | 1.4% |
[ 8.0% - 8.5% ] 8.32% | 289,330 | 1.4% |
[ 8.5% - 9.0% ] 8.54% | 325,718 | 1.6% |
[ 8.5% - 9.0% ] 8.82% | 299,483 | 1.5% |
[ 9.0% - 9.5% ] 9.05% | 411,065 | 1.4% |
[ 9.0% - 9.5% ] 9.22% | 256,772 | 2.5% |
[ 9.0% - 9.5% ] 9.39% | 511,894 | 2.0% |
[ 9.5% - 10.0% ] 9.71% | 426,617 | 2.0% |
[ 9.5% - 10.0% ] 9.85% | 315,856 | 1.9% |
[ 10.0% - 10.5% ] 10.15% | 437,971 | 1.7% |
[ 10.0% - 10.5% ] 10.29% | 280,288 | 1.6% |
[ 10.5% - 11.0% ] 10.54% | 331,090 | 1.9% |
[ 10.5% - 11.0% ] 10.76% | 624,858 | 1.5% |
[ 10.5% - 11.0% ] 10.99% | 98,434 | 1.6% |
[ 11.0% - 11.5% ] 11.13% | 104,054 | 1.2% |
[ 11.0% - 11.5% ] 11.40% | 339,283 | 1.7% |
[ 11.5% - 12.0% ] 11.60% | 195,524 | 1.8% |
[ 11.5% - 12.0% ] 11.83% | 187,238 | 2.0% |
[ 12.0% - 12.5% ] 12.11% | 47,175 | 1.00% |
[ 12.0% - 12.5% ] 12.31% | 82,318 | 1.2% |
[ 12.0% - 12.5% ] 12.49% | 166,015 | 1.6% |
[ 12.5% - 13.0% ] 12.67% | 122,114 | 1.3% |
[ 12.5% - 13.0% ] 12.88% | 63,193 | 1.8% |
[ 13.0% - 13.5% ] 13.14% | 62,519 | 1.8% |
[ 13.0% - 13.5% ] 13.39% | 104,532 | 2.2% |
[ 13.5% - 14.0% ] 13.61% | 136,078 | 1.4% |
[ 13.5% - 14.0% ] 13.70% | 131,525 | 1.7% |
[ 13.5% - 14.0% ] 13.94% | 83,315 | 1.6% |
[ 14.0% - 14.5% ] 14.13% | 159,514 | 1.8% |
[ 14.0% - 14.5% ] 14.34% | 88,280 | 1.5% |
[ 14.5% - 15.0% ] 14.73% | 46,765 | 1.8% |
[ 14.5% - 15.0% ] 14.78% | 14,658 | 2.0% |
[ 15.0% - 15.5% ] 15.00% | 204,934 | 1.7% |
[ 15.0% - 15.5% ] 15.21% | 22,030 | 2.2% |
[ 15.5% - 16.0% ] 15.50% | 115,278 | 2.1% |
[ 15.5% - 16.0% ] 15.82% | 84,812 | 1.0% |
[ 15.5% - 16.0% ] 15.89% | 4,960 | 1.1% |
[ 16.0% - 16.5% ] 16.13% | 35,507 | 1.3% |
[ 16.0% - 16.5% ] 16.33% | 93,461 | 1.5% |
[ 16.5% - 17.0% ] 16.65% | 256,521 | 1.8% |
[ 16.5% - 17.0% ] 16.73% | 24,444 | 1.2% |
[ 17.0% - 17.5% ] 17.04% | 158,485 | 2.1% |
[ 17.0% - 17.5% ] 17.31% | 15,571 | 1.3% |
[ 17.5% - 18.0% ] 17.71% | 86,266 | 0.70% |
[ 17.5% - 18.0% ] 17.90% | 98,975 | 1.2% |
[ 18.0% - 18.5% ] 18.09% | 140,890 | 1.5% |
[ 18.0% - 18.5% ] 18.31% | 14,345 | 1.6% |
[ 19.0% - 19.5% ] 19.04% | 124,761 | 1.3% |
[ 19.0% - 19.5% ] 19.10% | 11,603 | 1.0% |
[ 19.5% - 20.0% ] 19.82% | 79,891 | 2.2% |
[ 20.0% - 20.5% ] 20.26% | 316,805 | 2.0% |
[ 20.0% - 20.5% ] 20.44% | 61,414 | 1.8% |
[ 21.0% - 21.5% ] 21.02% | 55,440 | 2.3% |
[ 22.0% - 22.5% ] 22.12% | 22,796 | 0.99% |
[ 22.0% - 22.5% ] 22.19% | 89,256 | 1.9% |
[ 22.5% - 23.0% ] 22.63% | 38,567 | 1.1% |
[ 23.0% - 23.5% ] 23.35% | 27,571 | 3.2% |
[ 23.5% - 24.0% ] 23.73% | 53,464 | 1.9% |
[ 24.0% - 24.5% ] 24.16% | 21,806 | 2.6% |
[ 24.0% - 24.5% ] 24.39% | 7,972 | 0.97% |
[ 24.5% - 25.0% ] 24.65% | 20,954 | 1.1% |
[ 24.5% - 25.0% ] 24.87% | 599 | 3.2% |
[ 25.0% - 25.5% ] 25.02% | 44,439 | 0.96% |
[ 26.5% - 27.0% ] 26.93% | 18,068 | 1.2% |
[ 27.0% - 27.5% ] 27.46% | 5,018 | 2.1% |
[ 28.5% - 29.0% ] 28.69% | 3,879 | 1.8% |
[ 29.0% - 29.5% ] 29.34% | 2,560 | 1.4% |
[ 29.5% - 30.0% ] 29.66% | 5,867 | 0.47% |
[ 29.5% - 30.0% ] 29.99% | 64,161 | 1.1% |
[ 31.0% - 31.5% ] 31.09% | 341 | 1.8% |
[ 32.0% - 32.5% ] 32.07% | 10,514 | 0.030% |
[ 33.0% - 33.5% ] 33.47% | 44,570 | 1.0% |
[ 33.5% - 34.0% ] 33.71% | 20,693 | 1.3% |
[ 33.5% - 34.0% ] 33.85% | 15,585 | 1.5% |
[ 34.5% - 35.0% ] 34.84% | 37,022 | 2.2% |
[ 35.5% - 36.0% ] 35.56% | 1,049 | 0.69% |
[ 35.5% - 36.0% ] 35.84% | 39,565 | 2.3% |
[ 36.0% - 36.5% ] 36.30% | 146 | 3.0% |
[ 36.5% - 37.0% ] 36.72% | 1,999 | 1.1% |