Immigrants from Haiti Disability Age Under 5
COMPARE
Immigrants from Haiti
Select to Compare
Disability Age Under 5
Immigrants from Haiti Disability Age Under 5
1.3%
DISABILITY | AGE UNDER 5
40.2/ 100
METRIC RATING
187th/ 347
METRIC RANK
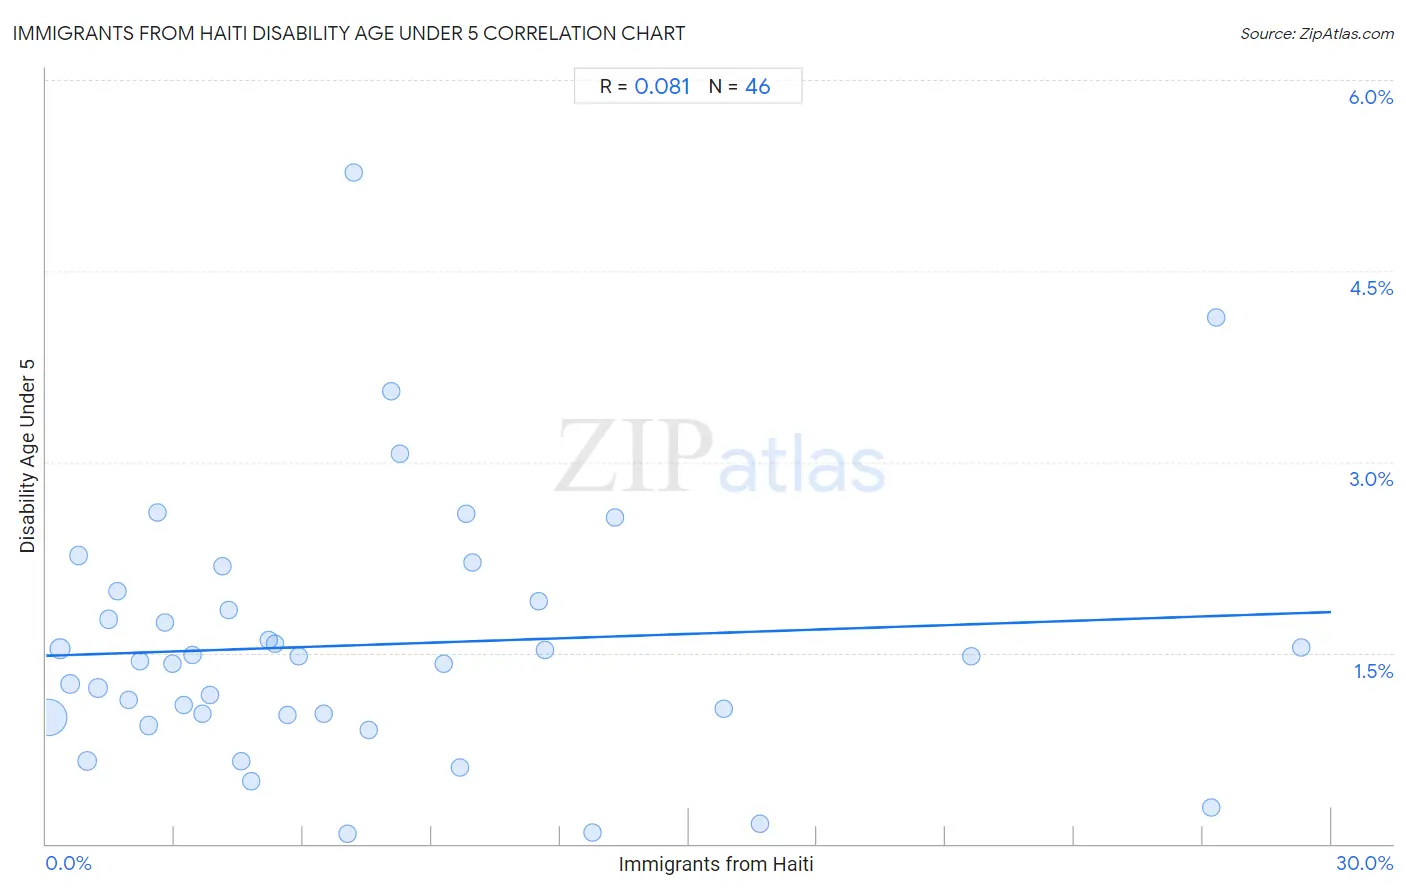
Immigrants from Haiti Disability Age Under 5 Correlation Chart
The statistical analysis conducted on geographies consisting of 137,993,145 people shows a slight positive correlation between the proportion of Immigrants from Haiti and percentage of population with a disability under the age of 5 in the United States with a correlation coefficient (R) of 0.081 and weighted average of 1.3%. On average, for every 1% (one percent) increase in Immigrants from Haiti within a typical geography, there is an increase of 0.011% in percentage of population with a disability under the age of 5.
It is essential to understand that the correlation between the percentage of Immigrants from Haiti and percentage of population with a disability under the age of 5 does not imply a direct cause-and-effect relationship. It remains uncertain whether the presence of Immigrants from Haiti influences an upward or downward trend in the level of percentage of population with a disability under the age of 5 within an area, or if Immigrants from Haiti simply ended up residing in those areas with higher or lower levels of percentage of population with a disability under the age of 5 due to other factors.
Demographics Similar to Immigrants from Haiti by Disability Age Under 5
In terms of disability age under 5, the demographic groups most similar to Immigrants from Haiti are Haitian (1.3%, a difference of 0.020%), Immigrants from Western Africa (1.2%, a difference of 0.21%), Cuban (1.2%, a difference of 0.21%), Peruvian (1.3%, a difference of 0.24%), and Palestinian (1.2%, a difference of 0.26%).
| Demographics | Rating | Rank | Disability Age Under 5 |
| Immigrants from Mexico | 44.4 /100 | #180 | Average 1.2% |
| Macedonians | 43.7 /100 | #181 | Average 1.2% |
| Immigrants from Peru | 43.7 /100 | #181 | Average 1.2% |
| Immigrants from Saudi Arabia | 43.3 /100 | #183 | Average 1.2% |
| Palestinians | 43.0 /100 | #184 | Average 1.2% |
| Immigrants from Western Africa | 42.5 /100 | #185 | Average 1.2% |
| Cubans | 42.5 /100 | #186 | Average 1.2% |
| Immigrants from Haiti | 40.2 /100 | #187 | Average 1.3% |
| Haitians | 39.9 /100 | #188 | Fair 1.3% |
| Peruvians | 37.6 /100 | #189 | Fair 1.3% |
| Immigrants from Laos | 36.6 /100 | #190 | Fair 1.3% |
| Mexican American Indians | 36.6 /100 | #191 | Fair 1.3% |
| Immigrants from Bosnia and Herzegovina | 36.5 /100 | #192 | Fair 1.3% |
| Immigrants from Sierra Leone | 36.5 /100 | #193 | Fair 1.3% |
| Immigrants from North Macedonia | 34.7 /100 | #194 | Fair 1.3% |
Immigrants from Haiti Disability Age Under 5 Correlation Summary
| Measurement | Immigrants from Haiti Data | Disability Age Under 5 Data |
| Minimum | 0.049% | 0.082% |
| Maximum | 29.3% | 5.3% |
| Range | 29.2% | 5.2% |
| Mean | 7.5% | 1.6% |
| Median | 5.3% | 1.5% |
| Interquartile 25% (IQ1) | 2.6% | 1.0% |
| Interquartile 75% (IQ3) | 9.8% | 1.9% |
| Interquartile Range (IQR) | 7.2% | 0.90% |
| Standard Deviation (Sample) | 7.2% | 1.0% |
| Standard Deviation (Population) | 7.1% | 1.0% |
Correlation Details
| Immigrants from Haiti Percentile | Sample Size | Disability Age Under 5 |
[ 0.0% - 0.5% ] 0.049% | 99,053,545 | 0.99% |
[ 0.0% - 0.5% ] 0.32% | 13,043,864 | 1.5% |
[ 0.5% - 1.0% ] 0.56% | 4,720,826 | 1.3% |
[ 0.5% - 1.0% ] 0.76% | 1,664,546 | 2.3% |
[ 0.5% - 1.0% ] 0.95% | 9,656,234 | 0.65% |
[ 1.0% - 1.5% ] 1.21% | 1,188,690 | 1.2% |
[ 1.0% - 1.5% ] 1.45% | 1,138,171 | 1.8% |
[ 1.5% - 2.0% ] 1.67% | 713,372 | 2.0% |
[ 1.5% - 2.0% ] 1.92% | 758,087 | 1.1% |
[ 2.0% - 2.5% ] 2.20% | 602,384 | 1.4% |
[ 2.0% - 2.5% ] 2.38% | 983,273 | 0.93% |
[ 2.5% - 3.0% ] 2.59% | 187,852 | 2.6% |
[ 2.5% - 3.0% ] 2.77% | 141,858 | 1.7% |
[ 2.5% - 3.0% ] 2.95% | 451,983 | 1.4% |
[ 3.0% - 3.5% ] 3.21% | 176,664 | 1.1% |
[ 3.0% - 3.5% ] 3.41% | 439,404 | 1.5% |
[ 3.5% - 4.0% ] 3.66% | 31,590 | 1.0% |
[ 3.5% - 4.0% ] 3.83% | 342,735 | 1.2% |
[ 4.0% - 4.5% ] 4.12% | 356,888 | 2.2% |
[ 4.0% - 4.5% ] 4.26% | 69,311 | 1.8% |
[ 4.5% - 5.0% ] 4.55% | 169,890 | 0.65% |
[ 4.5% - 5.0% ] 4.78% | 149,723 | 0.49% |
[ 5.0% - 5.5% ] 5.21% | 32,960 | 1.6% |
[ 5.0% - 5.5% ] 5.34% | 38,874 | 1.6% |
[ 5.5% - 6.0% ] 5.65% | 220,537 | 1.0% |
[ 5.5% - 6.0% ] 5.89% | 162,586 | 1.5% |
[ 6.0% - 6.5% ] 6.48% | 362,115 | 1.0% |
[ 7.0% - 7.5% ] 7.02% | 70,555 | 0.082% |
[ 7.0% - 7.5% ] 7.18% | 19,016 | 5.3% |
[ 7.5% - 8.0% ] 7.52% | 78,506 | 0.89% |
[ 8.0% - 8.5% ] 8.07% | 27,845 | 3.6% |
[ 8.0% - 8.5% ] 8.25% | 1,866 | 3.1% |
[ 9.0% - 9.5% ] 9.28% | 37,522 | 1.4% |
[ 9.5% - 10.0% ] 9.66% | 175,517 | 0.60% |
[ 9.5% - 10.0% ] 9.82% | 78,410 | 2.6% |
[ 9.5% - 10.0% ] 9.96% | 77,632 | 2.2% |
[ 11.5% - 12.0% ] 11.50% | 62,827 | 1.9% |
[ 11.5% - 12.0% ] 11.63% | 69,438 | 1.5% |
[ 12.5% - 13.0% ] 12.76% | 80,068 | 0.084% |
[ 13.0% - 13.5% ] 13.26% | 39,498 | 2.6% |
[ 15.5% - 16.0% ] 15.82% | 83,221 | 1.1% |
[ 16.5% - 17.0% ] 16.67% | 37,533 | 0.16% |
[ 21.5% - 22.0% ] 21.60% | 48,326 | 1.5% |
[ 27.0% - 27.5% ] 27.20% | 59,854 | 0.28% |
[ 27.0% - 27.5% ] 27.32% | 34,725 | 4.1% |
[ 29.0% - 29.5% ] 29.30% | 52,824 | 1.5% |