Immigrants from Haiti Wage/Income Gap
COMPARE
Immigrants from Haiti
Select to Compare
Wage/Income Gap
Immigrants from Haiti Wage/Income Gap
19.2%
WAGE/INCOME GAP
100.0/ 100
METRIC RATING
11th/ 347
METRIC RANK
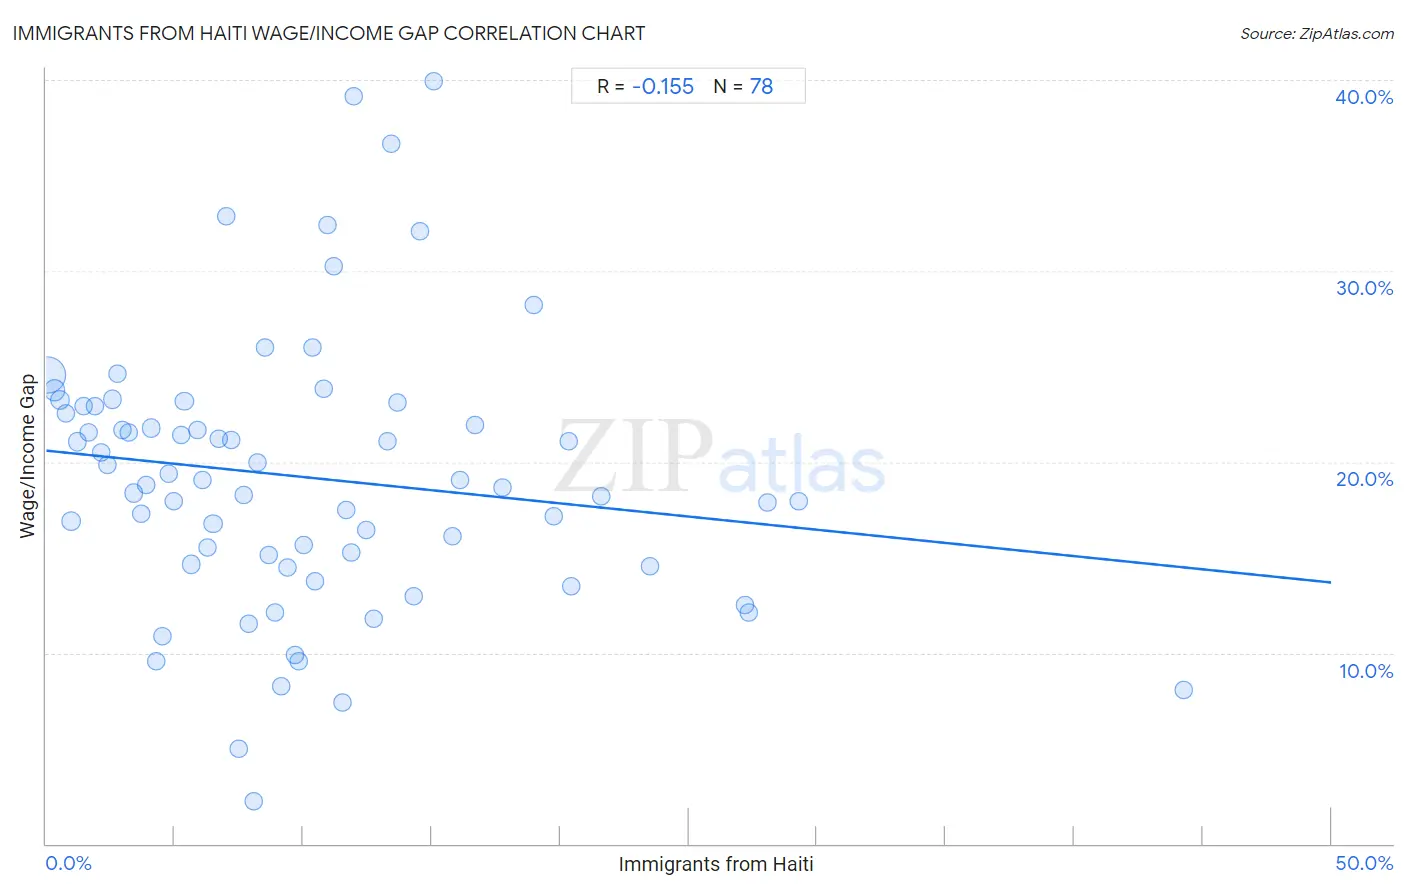
Immigrants from Haiti Wage/Income Gap Correlation Chart
The statistical analysis conducted on geographies consisting of 225,210,716 people shows a poor negative correlation between the proportion of Immigrants from Haiti and wage/income gap percentage in the United States with a correlation coefficient (R) of -0.155 and weighted average of 19.2%. On average, for every 1% (one percent) increase in Immigrants from Haiti within a typical geography, there is a decrease of 0.14% in wage/income gap percentage.
It is essential to understand that the correlation between the percentage of Immigrants from Haiti and wage/income gap percentage does not imply a direct cause-and-effect relationship. It remains uncertain whether the presence of Immigrants from Haiti influences an upward or downward trend in the level of wage/income gap percentage within an area, or if Immigrants from Haiti simply ended up residing in those areas with higher or lower levels of wage/income gap percentage due to other factors.
Demographics Similar to Immigrants from Haiti by Wage/Income Gap
In terms of wage/income gap, the demographic groups most similar to Immigrants from Haiti are Immigrants from West Indies (19.2%, a difference of 0.11%), Trinidadian and Tobagonian (19.3%, a difference of 0.59%), Immigrants from Trinidad and Tobago (19.3%, a difference of 0.64%), Crow (19.1%, a difference of 0.79%), and Barbadian (19.0%, a difference of 1.3%).
| Demographics | Rating | Rank | Wage/Income Gap |
| British West Indians | 100.0 /100 | #4 | Exceptional 18.0% |
| Guyanese | 100.0 /100 | #5 | Exceptional 18.3% |
| Immigrants from Guyana | 100.0 /100 | #6 | Exceptional 18.4% |
| Puerto Ricans | 100.0 /100 | #7 | Exceptional 18.7% |
| Immigrants from Jamaica | 100.0 /100 | #8 | Exceptional 18.8% |
| Barbadians | 100.0 /100 | #9 | Exceptional 19.0% |
| Crow | 100.0 /100 | #10 | Exceptional 19.1% |
| Immigrants from Haiti | 100.0 /100 | #11 | Exceptional 19.2% |
| Immigrants from West Indies | 100.0 /100 | #12 | Exceptional 19.2% |
| Trinidadians and Tobagonians | 100.0 /100 | #13 | Exceptional 19.3% |
| Immigrants from Trinidad and Tobago | 100.0 /100 | #14 | Exceptional 19.3% |
| West Indians | 100.0 /100 | #15 | Exceptional 19.6% |
| Jamaicans | 100.0 /100 | #16 | Exceptional 19.6% |
| Haitians | 100.0 /100 | #17 | Exceptional 19.7% |
| Hopi | 100.0 /100 | #18 | Exceptional 20.0% |
Immigrants from Haiti Wage/Income Gap Correlation Summary
| Measurement | Immigrants from Haiti Data | Wage/Income Gap Data |
| Minimum | 0.059% | 2.2% |
| Maximum | 44.3% | 39.9% |
| Range | 44.2% | 37.7% |
| Mean | 10.1% | 19.2% |
| Median | 8.6% | 18.9% |
| Interquartile 25% (IQ1) | 4.3% | 14.6% |
| Interquartile 75% (IQ3) | 13.4% | 22.9% |
| Interquartile Range (IQR) | 9.2% | 8.3% |
| Standard Deviation (Sample) | 8.0% | 7.2% |
| Standard Deviation (Population) | 8.0% | 7.1% |
Correlation Details
| Immigrants from Haiti Percentile | Sample Size | Wage/Income Gap |
[ 0.0% - 0.5% ] 0.059% | 149,764,932 | 24.6% |
[ 0.0% - 0.5% ] 0.32% | 25,694,313 | 23.7% |
[ 0.5% - 1.0% ] 0.55% | 10,879,114 | 23.2% |
[ 0.5% - 1.0% ] 0.76% | 5,323,962 | 22.5% |
[ 0.5% - 1.0% ] 0.96% | 11,589,422 | 16.9% |
[ 1.0% - 1.5% ] 1.21% | 2,367,551 | 21.0% |
[ 1.0% - 1.5% ] 1.44% | 2,360,034 | 22.9% |
[ 1.5% - 2.0% ] 1.66% | 1,822,018 | 21.5% |
[ 1.5% - 2.0% ] 1.90% | 1,315,617 | 22.9% |
[ 2.0% - 2.5% ] 2.15% | 1,366,656 | 20.5% |
[ 2.0% - 2.5% ] 2.36% | 1,517,471 | 19.8% |
[ 2.5% - 3.0% ] 2.56% | 1,064,641 | 23.3% |
[ 2.5% - 3.0% ] 2.77% | 438,489 | 24.6% |
[ 2.5% - 3.0% ] 2.97% | 661,727 | 21.7% |
[ 3.0% - 3.5% ] 3.22% | 360,863 | 21.5% |
[ 3.0% - 3.5% ] 3.41% | 549,024 | 18.4% |
[ 3.5% - 4.0% ] 3.68% | 399,105 | 17.3% |
[ 3.5% - 4.0% ] 3.87% | 583,958 | 18.8% |
[ 4.0% - 4.5% ] 4.09% | 708,303 | 21.8% |
[ 4.0% - 4.5% ] 4.26% | 190,277 | 9.5% |
[ 4.5% - 5.0% ] 4.53% | 547,833 | 10.9% |
[ 4.5% - 5.0% ] 4.77% | 434,151 | 19.4% |
[ 4.5% - 5.0% ] 4.96% | 212,869 | 18.0% |
[ 5.0% - 5.5% ] 5.23% | 275,766 | 21.4% |
[ 5.0% - 5.5% ] 5.37% | 197,198 | 23.2% |
[ 5.5% - 6.0% ] 5.66% | 289,842 | 14.6% |
[ 5.5% - 6.0% ] 5.89% | 207,895 | 21.7% |
[ 6.0% - 6.5% ] 6.09% | 164,952 | 19.0% |
[ 6.0% - 6.5% ] 6.25% | 70,731 | 15.5% |
[ 6.0% - 6.5% ] 6.49% | 385,906 | 16.8% |
[ 6.5% - 7.0% ] 6.69% | 60,922 | 21.2% |
[ 6.5% - 7.0% ] 6.99% | 108,023 | 32.9% |
[ 7.0% - 7.5% ] 7.18% | 144,847 | 21.1% |
[ 7.0% - 7.5% ] 7.48% | 99,835 | 5.0% |
[ 7.5% - 8.0% ] 7.66% | 92,012 | 18.3% |
[ 7.5% - 8.0% ] 7.88% | 178,368 | 11.5% |
[ 8.0% - 8.5% ] 8.07% | 27,845 | 2.2% |
[ 8.0% - 8.5% ] 8.24% | 4,262 | 20.0% |
[ 8.5% - 9.0% ] 8.53% | 35,760 | 26.0% |
[ 8.5% - 9.0% ] 8.68% | 46,881 | 15.1% |
[ 8.5% - 9.0% ] 8.91% | 89,129 | 12.1% |
[ 9.0% - 9.5% ] 9.16% | 259,345 | 8.3% |
[ 9.0% - 9.5% ] 9.37% | 4,939 | 14.4% |
[ 9.5% - 10.0% ] 9.66% | 175,517 | 9.9% |
[ 9.5% - 10.0% ] 9.82% | 171,255 | 9.6% |
[ 10.0% - 10.5% ] 10.02% | 320,218 | 15.6% |
[ 10.0% - 10.5% ] 10.37% | 38,809 | 26.0% |
[ 10.0% - 10.5% ] 10.45% | 20,503 | 13.7% |
[ 10.5% - 11.0% ] 10.77% | 138,859 | 23.8% |
[ 10.5% - 11.0% ] 10.95% | 1,041 | 32.4% |
[ 11.0% - 11.5% ] 11.18% | 70,829 | 30.2% |
[ 11.5% - 12.0% ] 11.50% | 62,827 | 7.4% |
[ 11.5% - 12.0% ] 11.65% | 234,322 | 17.5% |
[ 11.5% - 12.0% ] 11.86% | 103,175 | 15.2% |
[ 11.5% - 12.0% ] 11.96% | 761 | 39.1% |
[ 12.0% - 12.5% ] 12.46% | 114,188 | 16.4% |
[ 12.5% - 13.0% ] 12.77% | 109,896 | 11.8% |
[ 13.0% - 13.5% ] 13.26% | 39,498 | 21.1% |
[ 13.0% - 13.5% ] 13.45% | 1,904 | 36.7% |
[ 13.5% - 14.0% ] 13.65% | 7,054 | 23.1% |
[ 14.0% - 14.5% ] 14.32% | 93,515 | 13.0% |
[ 14.5% - 15.0% ] 14.56% | 36,155 | 32.1% |
[ 15.0% - 15.5% ] 15.08% | 8,996 | 39.9% |
[ 15.5% - 16.0% ] 15.82% | 83,221 | 16.1% |
[ 16.0% - 16.5% ] 16.08% | 105,835 | 19.1% |
[ 16.5% - 17.0% ] 16.67% | 37,533 | 21.9% |
[ 17.5% - 18.0% ] 17.78% | 35,914 | 18.6% |
[ 18.5% - 19.0% ] 18.98% | 764 | 28.2% |
[ 19.5% - 20.0% ] 19.73% | 22,823 | 17.2% |
[ 20.0% - 20.5% ] 20.35% | 31,807 | 21.1% |
[ 20.0% - 20.5% ] 20.42% | 2,743 | 13.5% |
[ 21.5% - 22.0% ] 21.60% | 48,326 | 18.2% |
[ 23.5% - 24.0% ] 23.50% | 2,974 | 14.5% |
[ 27.0% - 27.5% ] 27.17% | 83,312 | 12.5% |
[ 27.0% - 27.5% ] 27.32% | 34,725 | 12.1% |
[ 28.0% - 28.5% ] 28.08% | 20,030 | 17.9% |
[ 29.0% - 29.5% ] 29.30% | 52,824 | 18.0% |
[ 44.0% - 44.5% ] 44.28% | 1,775 | 8.0% |