Immigrants from Haiti GED/Equivalency
COMPARE
Immigrants from Haiti
Select to Compare
GED/Equivalency
Immigrants from Haiti GED/Equivalency
81.6%
GED/EQUIVALENCY
0.0/ 100
METRIC RATING
302nd/ 347
METRIC RANK
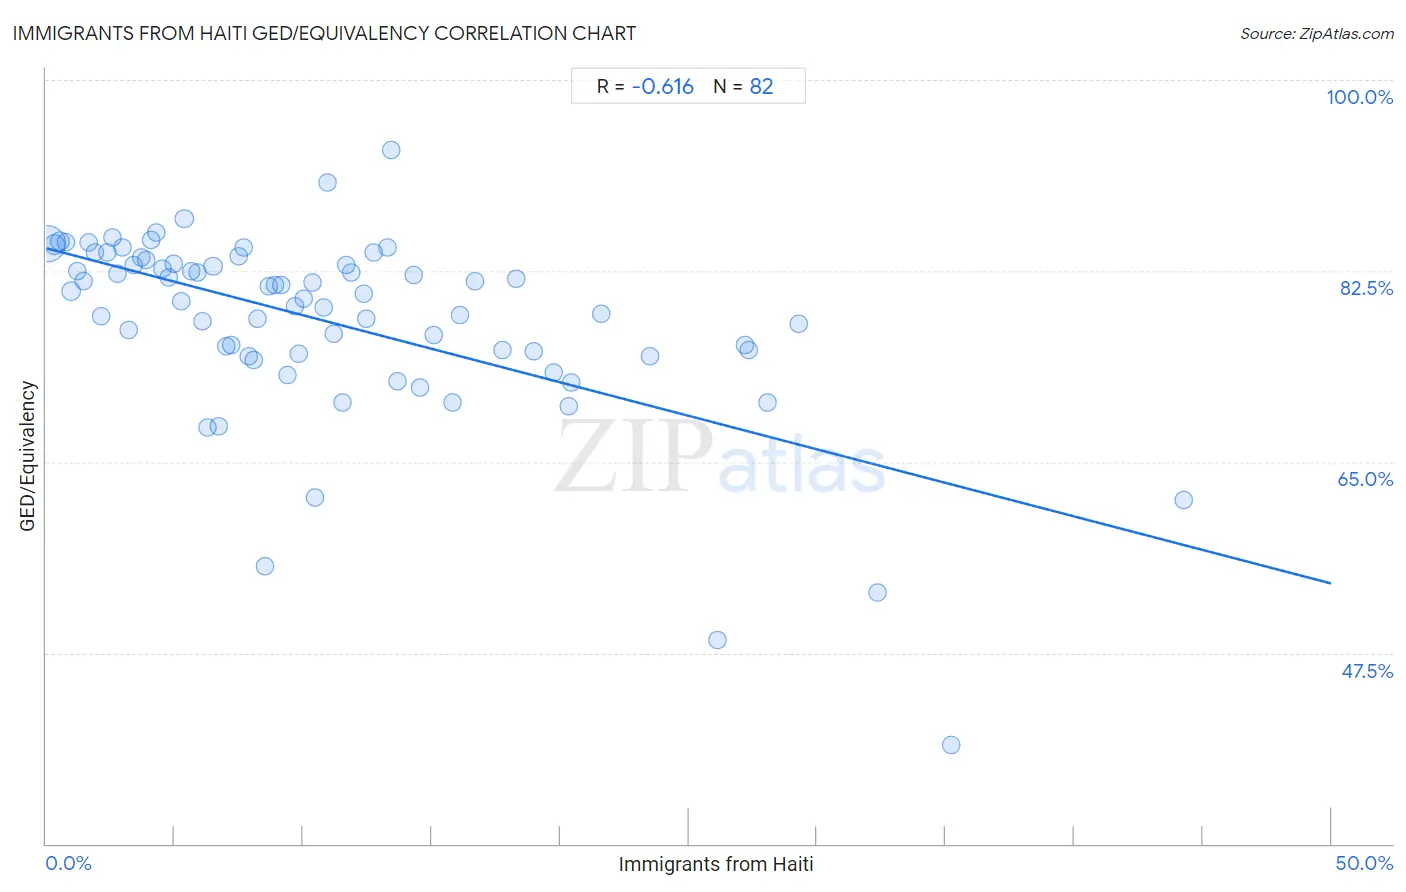
Immigrants from Haiti GED/Equivalency Correlation Chart
The statistical analysis conducted on geographies consisting of 225,286,636 people shows a significant negative correlation between the proportion of Immigrants from Haiti and percentage of population with at least ged/equivalency education in the United States with a correlation coefficient (R) of -0.616 and weighted average of 81.6%. On average, for every 1% (one percent) increase in Immigrants from Haiti within a typical geography, there is a decrease of 0.61% in percentage of population with at least ged/equivalency education.
It is essential to understand that the correlation between the percentage of Immigrants from Haiti and percentage of population with at least ged/equivalency education does not imply a direct cause-and-effect relationship. It remains uncertain whether the presence of Immigrants from Haiti influences an upward or downward trend in the level of percentage of population with at least ged/equivalency education within an area, or if Immigrants from Haiti simply ended up residing in those areas with higher or lower levels of percentage of population with at least ged/equivalency education due to other factors.
Demographics Similar to Immigrants from Haiti by GED/Equivalency
In terms of ged/equivalency, the demographic groups most similar to Immigrants from Haiti are Immigrants from Portugal (81.6%, a difference of 0.0%), Dutch West Indian (81.6%, a difference of 0.040%), Fijian (81.6%, a difference of 0.10%), Navajo (81.5%, a difference of 0.10%), and Ecuadorian (81.7%, a difference of 0.16%).
| Demographics | Rating | Rank | GED/Equivalency |
| Nepalese | 0.0 /100 | #295 | Tragic 81.9% |
| Vietnamese | 0.0 /100 | #296 | Tragic 81.9% |
| Immigrants from Bangladesh | 0.0 /100 | #297 | Tragic 81.9% |
| Ute | 0.0 /100 | #298 | Tragic 81.8% |
| Ecuadorians | 0.0 /100 | #299 | Tragic 81.7% |
| Fijians | 0.0 /100 | #300 | Tragic 81.6% |
| Dutch West Indians | 0.0 /100 | #301 | Tragic 81.6% |
| Immigrants from Haiti | 0.0 /100 | #302 | Tragic 81.6% |
| Immigrants from Portugal | 0.0 /100 | #303 | Tragic 81.6% |
| Navajo | 0.0 /100 | #304 | Tragic 81.5% |
| Immigrants from Grenada | 0.0 /100 | #305 | Tragic 81.3% |
| Guyanese | 0.0 /100 | #306 | Tragic 81.3% |
| Immigrants from Dominica | 0.0 /100 | #307 | Tragic 81.1% |
| Puerto Ricans | 0.0 /100 | #308 | Tragic 81.1% |
| Immigrants from Ecuador | 0.0 /100 | #309 | Tragic 81.0% |
Immigrants from Haiti GED/Equivalency Correlation Summary
| Measurement | Immigrants from Haiti Data | GED/Equivalency Data |
| Minimum | 0.059% | 39.0% |
| Maximum | 44.3% | 93.6% |
| Range | 44.2% | 54.6% |
| Mean | 11.0% | 77.8% |
| Median | 9.0% | 80.2% |
| Interquartile 25% (IQ1) | 4.5% | 74.9% |
| Interquartile 75% (IQ3) | 14.6% | 83.1% |
| Interquartile Range (IQR) | 10.0% | 8.2% |
| Standard Deviation (Sample) | 8.9% | 8.8% |
| Standard Deviation (Population) | 8.8% | 8.8% |
Correlation Details
| Immigrants from Haiti Percentile | Sample Size | GED/Equivalency |
[ 0.0% - 0.5% ] 0.059% | 149,785,496 | 85.0% |
[ 0.0% - 0.5% ] 0.32% | 25,710,206 | 84.9% |
[ 0.5% - 1.0% ] 0.55% | 10,890,699 | 85.2% |
[ 0.5% - 1.0% ] 0.76% | 5,333,119 | 85.1% |
[ 0.5% - 1.0% ] 0.96% | 11,591,036 | 80.7% |
[ 1.0% - 1.5% ] 1.21% | 2,368,821 | 82.5% |
[ 1.0% - 1.5% ] 1.44% | 2,360,288 | 81.6% |
[ 1.5% - 2.0% ] 1.66% | 1,824,111 | 85.1% |
[ 1.5% - 2.0% ] 1.90% | 1,317,205 | 84.2% |
[ 2.0% - 2.5% ] 2.15% | 1,368,045 | 78.4% |
[ 2.0% - 2.5% ] 2.36% | 1,519,454 | 84.2% |
[ 2.5% - 3.0% ] 2.56% | 1,066,112 | 85.6% |
[ 2.5% - 3.0% ] 2.77% | 438,675 | 82.2% |
[ 2.5% - 3.0% ] 2.97% | 662,312 | 84.7% |
[ 3.0% - 3.5% ] 3.22% | 360,863 | 77.1% |
[ 3.0% - 3.5% ] 3.41% | 549,921 | 83.0% |
[ 3.5% - 4.0% ] 3.68% | 399,742 | 83.8% |
[ 3.5% - 4.0% ] 3.87% | 583,958 | 83.5% |
[ 4.0% - 4.5% ] 4.09% | 709,487 | 85.3% |
[ 4.0% - 4.5% ] 4.27% | 190,548 | 86.0% |
[ 4.5% - 5.0% ] 4.53% | 547,833 | 82.7% |
[ 4.5% - 5.0% ] 4.77% | 434,151 | 81.9% |
[ 4.5% - 5.0% ] 4.96% | 212,869 | 83.1% |
[ 5.0% - 5.5% ] 5.23% | 275,766 | 79.8% |
[ 5.0% - 5.5% ] 5.37% | 197,198 | 87.3% |
[ 5.5% - 6.0% ] 5.66% | 289,842 | 82.5% |
[ 5.5% - 6.0% ] 5.89% | 207,895 | 82.3% |
[ 6.0% - 6.5% ] 6.09% | 165,231 | 77.9% |
[ 6.0% - 6.5% ] 6.25% | 70,731 | 68.2% |
[ 6.0% - 6.5% ] 6.49% | 385,906 | 82.9% |
[ 6.5% - 7.0% ] 6.69% | 62,032 | 68.2% |
[ 6.5% - 7.0% ] 6.99% | 108,023 | 75.6% |
[ 7.0% - 7.5% ] 7.18% | 144,847 | 75.7% |
[ 7.0% - 7.5% ] 7.48% | 99,835 | 83.9% |
[ 7.5% - 8.0% ] 7.66% | 92,012 | 84.7% |
[ 7.5% - 8.0% ] 7.88% | 178,368 | 74.7% |
[ 8.0% - 8.5% ] 8.07% | 27,845 | 74.4% |
[ 8.0% - 8.5% ] 8.24% | 4,526 | 78.1% |
[ 8.5% - 9.0% ] 8.53% | 35,760 | 55.4% |
[ 8.5% - 9.0% ] 8.68% | 46,881 | 81.1% |
[ 8.5% - 9.0% ] 8.91% | 89,129 | 81.2% |
[ 9.0% - 9.5% ] 9.16% | 259,345 | 81.2% |
[ 9.0% - 9.5% ] 9.37% | 4,939 | 73.0% |
[ 9.5% - 10.0% ] 9.66% | 175,517 | 79.3% |
[ 9.5% - 10.0% ] 9.82% | 171,255 | 74.9% |
[ 10.0% - 10.5% ] 10.02% | 320,218 | 80.0% |
[ 10.0% - 10.5% ] 10.37% | 38,809 | 81.5% |
[ 10.0% - 10.5% ] 10.45% | 20,503 | 61.7% |
[ 10.5% - 11.0% ] 10.77% | 138,934 | 79.1% |
[ 10.5% - 11.0% ] 10.95% | 1,041 | 90.6% |
[ 11.0% - 11.5% ] 11.18% | 70,829 | 76.7% |
[ 11.5% - 12.0% ] 11.50% | 62,827 | 70.5% |
[ 11.5% - 12.0% ] 11.65% | 234,322 | 83.1% |
[ 11.5% - 12.0% ] 11.86% | 103,175 | 82.4% |
[ 12.0% - 12.5% ] 12.37% | 938 | 80.4% |
[ 12.0% - 12.5% ] 12.46% | 114,188 | 78.1% |
[ 12.5% - 13.0% ] 12.77% | 109,896 | 84.2% |
[ 13.0% - 13.5% ] 13.26% | 39,498 | 84.6% |
[ 13.0% - 13.5% ] 13.45% | 1,904 | 93.6% |
[ 13.5% - 14.0% ] 13.65% | 7,054 | 72.3% |
[ 14.0% - 14.5% ] 14.32% | 93,515 | 82.1% |
[ 14.5% - 15.0% ] 14.56% | 36,155 | 71.8% |
[ 15.0% - 15.5% ] 15.08% | 8,996 | 76.6% |
[ 15.5% - 16.0% ] 15.82% | 83,221 | 70.4% |
[ 16.0% - 16.5% ] 16.08% | 105,835 | 78.5% |
[ 16.5% - 17.0% ] 16.67% | 37,533 | 81.6% |
[ 17.5% - 18.0% ] 17.78% | 35,914 | 75.3% |
[ 18.0% - 18.5% ] 18.27% | 104 | 81.8% |
[ 18.5% - 19.0% ] 18.98% | 764 | 75.1% |
[ 19.5% - 20.0% ] 19.73% | 22,823 | 73.2% |
[ 20.0% - 20.5% ] 20.35% | 31,807 | 70.1% |
[ 20.0% - 20.5% ] 20.42% | 2,743 | 72.2% |
[ 21.5% - 22.0% ] 21.60% | 48,326 | 78.6% |
[ 23.5% - 24.0% ] 23.50% | 2,974 | 74.7% |
[ 26.0% - 26.5% ] 26.11% | 314 | 48.7% |
[ 27.0% - 27.5% ] 27.17% | 83,312 | 75.7% |
[ 27.0% - 27.5% ] 27.32% | 34,725 | 75.3% |
[ 28.0% - 28.5% ] 28.08% | 20,030 | 70.4% |
[ 29.0% - 29.5% ] 29.30% | 52,824 | 77.6% |
[ 32.0% - 32.5% ] 32.36% | 445 | 53.0% |
[ 35.0% - 35.5% ] 35.22% | 531 | 39.0% |
[ 44.0% - 44.5% ] 44.28% | 1,775 | 61.5% |