Immigrants from Haiti Self-Care Disability
COMPARE
Immigrants from Haiti
Select to Compare
Self-Care Disability
Immigrants from Haiti Self-Care Disability
2.6%
SELF-CARE DISABILITY
0.3/ 100
METRIC RATING
253rd/ 347
METRIC RANK
Immigrants from Haiti Self-Care Disability Correlation Chart
The statistical analysis conducted on geographies consisting of 225,098,075 people shows a weak negative correlation between the proportion of Immigrants from Haiti and percentage of population with self-care disability in the United States with a correlation coefficient (R) of -0.260 and weighted average of 2.6%. On average, for every 1% (one percent) increase in Immigrants from Haiti within a typical geography, there is a decrease of 0.024% in percentage of population with self-care disability.
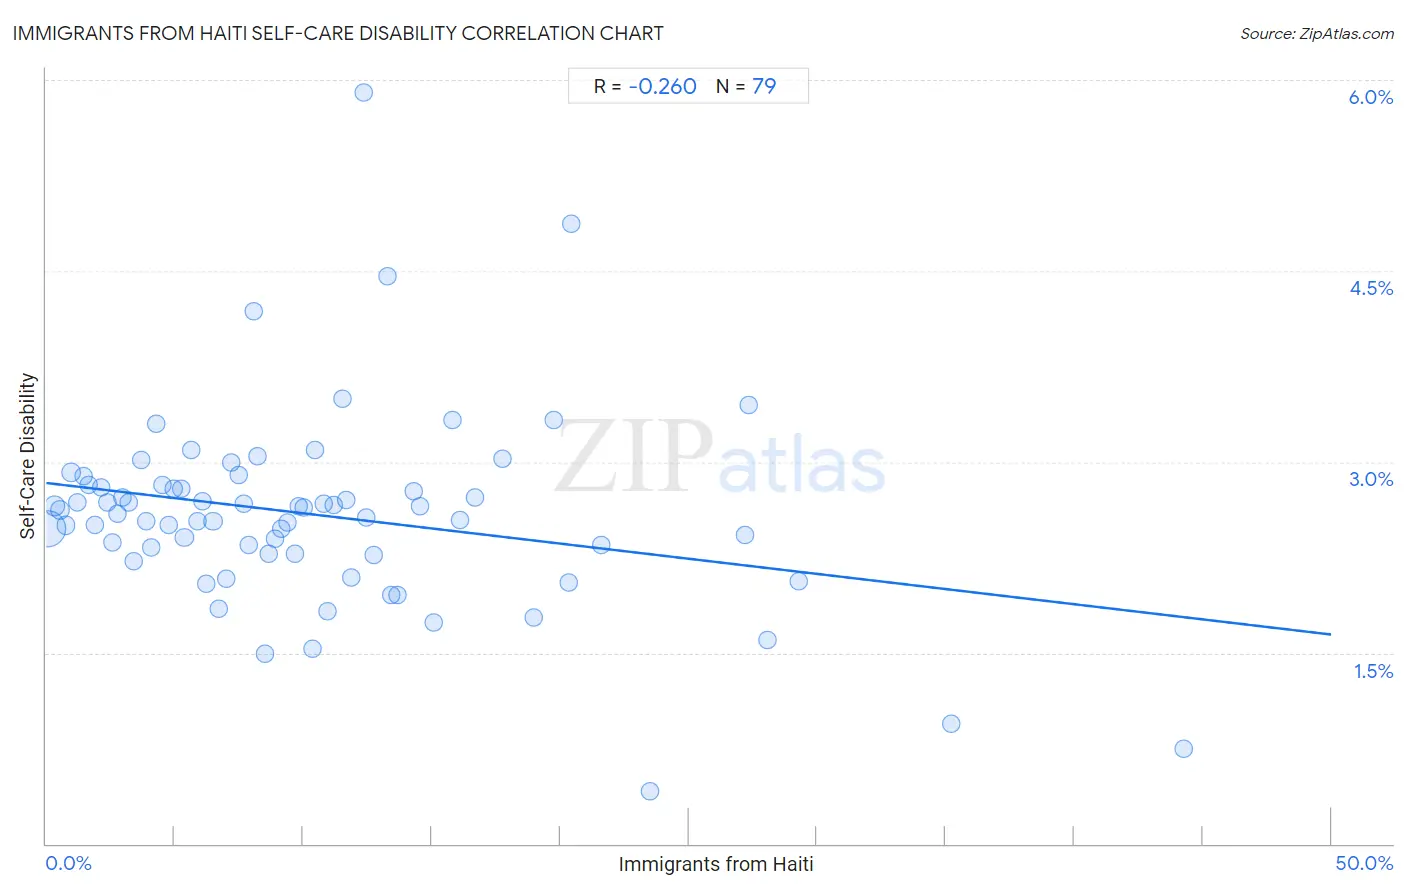
It is essential to understand that the correlation between the percentage of Immigrants from Haiti and percentage of population with self-care disability does not imply a direct cause-and-effect relationship. It remains uncertain whether the presence of Immigrants from Haiti influences an upward or downward trend in the level of percentage of population with self-care disability within an area, or if Immigrants from Haiti simply ended up residing in those areas with higher or lower levels of percentage of population with self-care disability due to other factors.
Demographics Similar to Immigrants from Haiti by Self-Care Disability
In terms of self-care disability, the demographic groups most similar to Immigrants from Haiti are Haitian (2.6%, a difference of 0.020%), Tsimshian (2.6%, a difference of 0.060%), Immigrants from Bangladesh (2.6%, a difference of 0.080%), Immigrants from Central America (2.6%, a difference of 0.080%), and Immigrants from Liberia (2.6%, a difference of 0.15%).
| Demographics | Rating | Rank | Self-Care Disability |
| Cheyenne | 0.6 /100 | #246 | Tragic 2.6% |
| Immigrants from Albania | 0.6 /100 | #247 | Tragic 2.6% |
| Nicaraguans | 0.6 /100 | #248 | Tragic 2.6% |
| Mexican American Indians | 0.5 /100 | #249 | Tragic 2.6% |
| Portuguese | 0.4 /100 | #250 | Tragic 2.6% |
| Immigrants from Liberia | 0.4 /100 | #251 | Tragic 2.6% |
| Immigrants from Bangladesh | 0.4 /100 | #252 | Tragic 2.6% |
| Immigrants from Haiti | 0.3 /100 | #253 | Tragic 2.6% |
| Haitians | 0.3 /100 | #254 | Tragic 2.6% |
| Tsimshian | 0.3 /100 | #255 | Tragic 2.6% |
| Immigrants from Central America | 0.3 /100 | #256 | Tragic 2.6% |
| Potawatomi | 0.3 /100 | #257 | Tragic 2.6% |
| Nonimmigrants | 0.3 /100 | #258 | Tragic 2.6% |
| Immigrants from Belarus | 0.2 /100 | #259 | Tragic 2.6% |
| Chippewa | 0.2 /100 | #260 | Tragic 2.6% |
Immigrants from Haiti Self-Care Disability Correlation Summary
| Measurement | Immigrants from Haiti Data | Self-Care Disability Data |
| Minimum | 0.059% | 0.41% |
| Maximum | 44.3% | 5.9% |
| Range | 44.2% | 5.5% |
| Mean | 10.5% | 2.6% |
| Median | 8.7% | 2.6% |
| Interquartile 25% (IQ1) | 4.3% | 2.3% |
| Interquartile 75% (IQ3) | 13.7% | 2.8% |
| Interquartile Range (IQR) | 9.4% | 0.53% |
| Standard Deviation (Sample) | 8.5% | 0.78% |
| Standard Deviation (Population) | 8.4% | 0.77% |
Correlation Details
| Immigrants from Haiti Percentile | Sample Size | Self-Care Disability |
[ 0.0% - 0.5% ] 0.059% | 149,679,138 | 2.5% |
[ 0.0% - 0.5% ] 0.32% | 25,684,537 | 2.7% |
[ 0.5% - 1.0% ] 0.55% | 10,866,170 | 2.6% |
[ 0.5% - 1.0% ] 0.76% | 5,325,713 | 2.5% |
[ 0.5% - 1.0% ] 0.96% | 11,580,893 | 2.9% |
[ 1.0% - 1.5% ] 1.21% | 2,368,562 | 2.7% |
[ 1.0% - 1.5% ] 1.44% | 2,360,288 | 2.9% |
[ 1.5% - 2.0% ] 1.66% | 1,822,262 | 2.8% |
[ 1.5% - 2.0% ] 1.90% | 1,316,541 | 2.5% |
[ 2.0% - 2.5% ] 2.15% | 1,367,702 | 2.8% |
[ 2.0% - 2.5% ] 2.36% | 1,519,279 | 2.7% |
[ 2.5% - 3.0% ] 2.56% | 1,064,068 | 2.4% |
[ 2.5% - 3.0% ] 2.77% | 438,300 | 2.6% |
[ 2.5% - 3.0% ] 2.97% | 662,045 | 2.7% |
[ 3.0% - 3.5% ] 3.22% | 360,275 | 2.7% |
[ 3.0% - 3.5% ] 3.41% | 549,921 | 2.2% |
[ 3.5% - 4.0% ] 3.68% | 399,239 | 3.0% |
[ 3.5% - 4.0% ] 3.87% | 583,958 | 2.5% |
[ 4.0% - 4.5% ] 4.09% | 708,303 | 2.3% |
[ 4.0% - 4.5% ] 4.26% | 190,277 | 3.3% |
[ 4.5% - 5.0% ] 4.53% | 547,833 | 2.8% |
[ 4.5% - 5.0% ] 4.77% | 434,151 | 2.5% |
[ 4.5% - 5.0% ] 4.96% | 212,869 | 2.8% |
[ 5.0% - 5.5% ] 5.23% | 275,766 | 2.8% |
[ 5.0% - 5.5% ] 5.37% | 197,198 | 2.4% |
[ 5.5% - 6.0% ] 5.66% | 286,316 | 3.1% |
[ 5.5% - 6.0% ] 5.89% | 207,895 | 2.5% |
[ 6.0% - 6.5% ] 6.09% | 165,231 | 2.7% |
[ 6.0% - 6.5% ] 6.25% | 70,245 | 2.0% |
[ 6.0% - 6.5% ] 6.49% | 385,906 | 2.5% |
[ 6.5% - 7.0% ] 6.69% | 61,780 | 1.8% |
[ 6.5% - 7.0% ] 6.99% | 108,023 | 2.1% |
[ 7.0% - 7.5% ] 7.18% | 144,847 | 3.0% |
[ 7.0% - 7.5% ] 7.48% | 99,835 | 2.9% |
[ 7.5% - 8.0% ] 7.66% | 92,012 | 2.7% |
[ 7.5% - 8.0% ] 7.88% | 178,368 | 2.3% |
[ 8.0% - 8.5% ] 8.07% | 27,845 | 4.2% |
[ 8.0% - 8.5% ] 8.22% | 3,794 | 3.0% |
[ 8.5% - 9.0% ] 8.53% | 35,760 | 1.5% |
[ 8.5% - 9.0% ] 8.68% | 46,881 | 2.3% |
[ 8.5% - 9.0% ] 8.91% | 89,129 | 2.4% |
[ 9.0% - 9.5% ] 9.16% | 259,345 | 2.5% |
[ 9.0% - 9.5% ] 9.37% | 4,939 | 2.5% |
[ 9.5% - 10.0% ] 9.66% | 175,517 | 2.3% |
[ 9.5% - 10.0% ] 9.82% | 171,255 | 2.6% |
[ 10.0% - 10.5% ] 10.02% | 320,218 | 2.6% |
[ 10.0% - 10.5% ] 10.37% | 38,809 | 1.5% |
[ 10.0% - 10.5% ] 10.45% | 20,503 | 3.1% |
[ 10.5% - 11.0% ] 10.77% | 138,859 | 2.7% |
[ 10.5% - 11.0% ] 10.95% | 1,041 | 1.8% |
[ 11.0% - 11.5% ] 11.18% | 70,829 | 2.7% |
[ 11.5% - 12.0% ] 11.50% | 62,827 | 3.5% |
[ 11.5% - 12.0% ] 11.65% | 234,322 | 2.7% |
[ 11.5% - 12.0% ] 11.86% | 103,175 | 2.1% |
[ 12.0% - 12.5% ] 12.37% | 938 | 5.9% |
[ 12.0% - 12.5% ] 12.46% | 114,188 | 2.6% |
[ 12.5% - 13.0% ] 12.77% | 109,896 | 2.3% |
[ 13.0% - 13.5% ] 13.26% | 39,498 | 4.5% |
[ 13.0% - 13.5% ] 13.45% | 1,904 | 2.0% |
[ 13.5% - 14.0% ] 13.65% | 7,054 | 2.0% |
[ 14.0% - 14.5% ] 14.32% | 93,515 | 2.8% |
[ 14.5% - 15.0% ] 14.56% | 36,155 | 2.6% |
[ 15.0% - 15.5% ] 15.08% | 8,996 | 1.7% |
[ 15.5% - 16.0% ] 15.82% | 83,221 | 3.3% |
[ 16.0% - 16.5% ] 16.08% | 105,835 | 2.5% |
[ 16.5% - 17.0% ] 16.67% | 37,533 | 2.7% |
[ 17.5% - 18.0% ] 17.78% | 35,914 | 3.0% |
[ 18.5% - 19.0% ] 18.98% | 764 | 1.8% |
[ 19.5% - 20.0% ] 19.73% | 22,823 | 3.3% |
[ 20.0% - 20.5% ] 20.35% | 31,807 | 2.1% |
[ 20.0% - 20.5% ] 20.42% | 2,743 | 4.9% |
[ 21.5% - 22.0% ] 21.60% | 48,326 | 2.3% |
[ 23.5% - 24.0% ] 23.50% | 2,974 | 0.41% |
[ 27.0% - 27.5% ] 27.17% | 83,312 | 2.4% |
[ 27.0% - 27.5% ] 27.32% | 34,725 | 3.4% |
[ 28.0% - 28.5% ] 28.08% | 20,030 | 1.6% |
[ 29.0% - 29.5% ] 29.30% | 52,824 | 2.1% |
[ 35.0% - 35.5% ] 35.22% | 531 | 0.94% |
[ 44.0% - 44.5% ] 44.28% | 1,775 | 0.75% |