Immigrants from Ghana Self-Care Disability
COMPARE
Immigrants from Ghana
Select to Compare
Self-Care Disability
Immigrants from Ghana Self-Care Disability
2.5%
SELF-CARE DISABILITY
14.7/ 100
METRIC RATING
199th/ 347
METRIC RANK
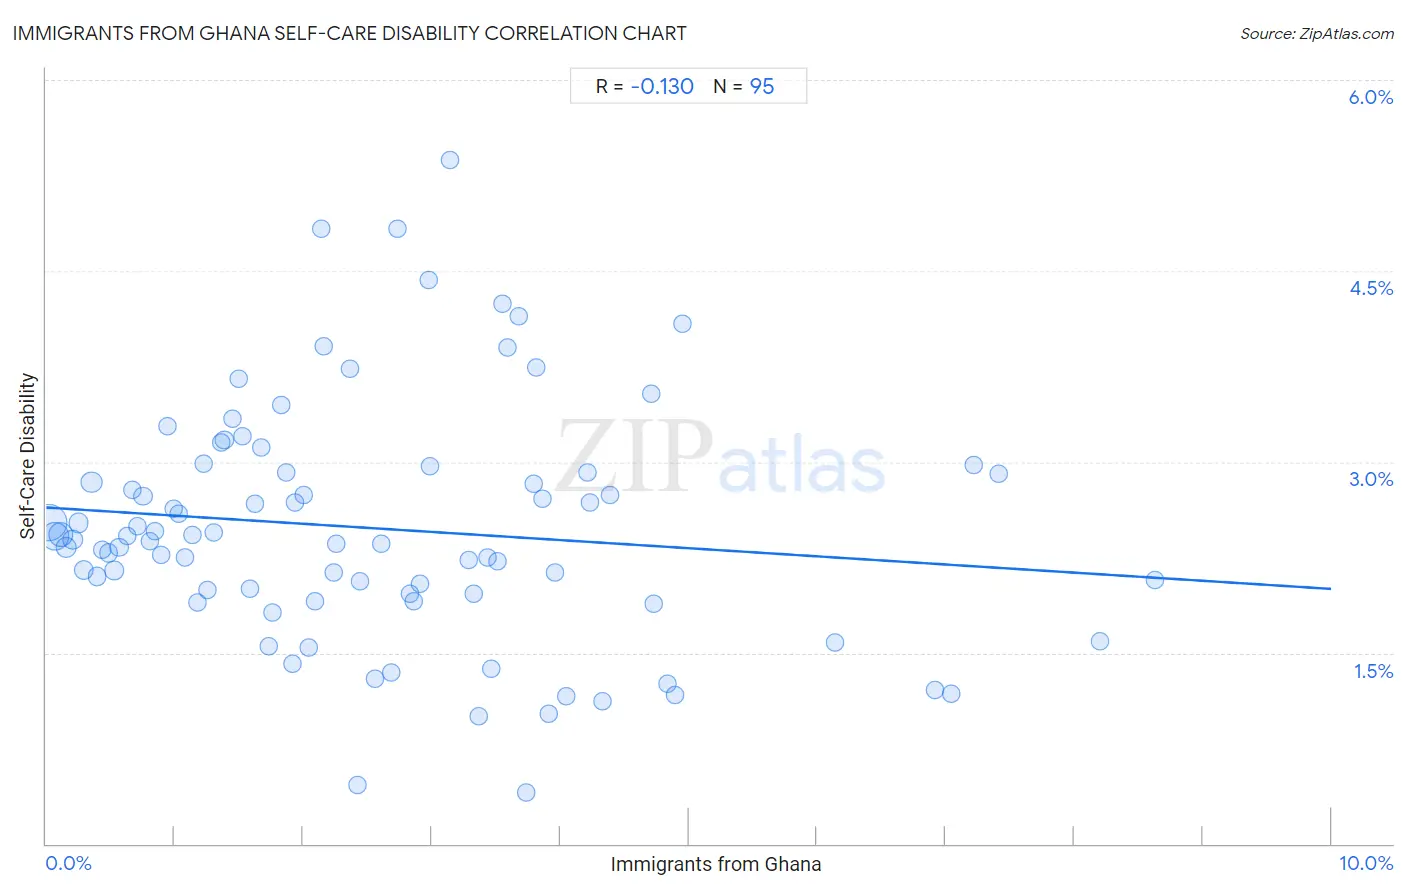
Immigrants from Ghana Self-Care Disability Correlation Chart
The statistical analysis conducted on geographies consisting of 199,790,257 people shows a poor negative correlation between the proportion of Immigrants from Ghana and percentage of population with self-care disability in the United States with a correlation coefficient (R) of -0.130 and weighted average of 2.5%. On average, for every 1% (one percent) increase in Immigrants from Ghana within a typical geography, there is a decrease of 0.064% in percentage of population with self-care disability.
It is essential to understand that the correlation between the percentage of Immigrants from Ghana and percentage of population with self-care disability does not imply a direct cause-and-effect relationship. It remains uncertain whether the presence of Immigrants from Ghana influences an upward or downward trend in the level of percentage of population with self-care disability within an area, or if Immigrants from Ghana simply ended up residing in those areas with higher or lower levels of percentage of population with self-care disability due to other factors.
Demographics Similar to Immigrants from Ghana by Self-Care Disability
In terms of self-care disability, the demographic groups most similar to Immigrants from Ghana are Immigrants (2.5%, a difference of 0.020%), Crow (2.5%, a difference of 0.050%), Korean (2.5%, a difference of 0.070%), Immigrants from Southern Europe (2.5%, a difference of 0.080%), and Immigrants from Western Africa (2.5%, a difference of 0.14%).
| Demographics | Rating | Rank | Self-Care Disability |
| Soviet Union | 22.2 /100 | #192 | Fair 2.5% |
| Ukrainians | 21.4 /100 | #193 | Fair 2.5% |
| Immigrants from Germany | 17.9 /100 | #194 | Poor 2.5% |
| Immigrants from Southern Europe | 15.6 /100 | #195 | Poor 2.5% |
| Koreans | 15.5 /100 | #196 | Poor 2.5% |
| Crow | 15.2 /100 | #197 | Poor 2.5% |
| Immigrants | 15.0 /100 | #198 | Poor 2.5% |
| Immigrants from Ghana | 14.7 /100 | #199 | Poor 2.5% |
| Immigrants from Western Africa | 13.3 /100 | #200 | Poor 2.5% |
| Immigrants from South Eastern Asia | 12.9 /100 | #201 | Poor 2.5% |
| Slovaks | 12.6 /100 | #202 | Poor 2.5% |
| Immigrants from Lebanon | 12.4 /100 | #203 | Poor 2.5% |
| Immigrants from Bahamas | 11.9 /100 | #204 | Poor 2.5% |
| Immigrants from Russia | 11.0 /100 | #205 | Poor 2.5% |
| Alaskan Athabascans | 10.4 /100 | #206 | Poor 2.5% |
Immigrants from Ghana Self-Care Disability Correlation Summary
| Measurement | Immigrants from Ghana Data | Self-Care Disability Data |
| Minimum | 0.023% | 0.40% |
| Maximum | 8.6% | 5.4% |
| Range | 8.6% | 5.0% |
| Mean | 2.6% | 2.5% |
| Median | 2.2% | 2.4% |
| Interquartile 25% (IQ1) | 1.1% | 2.0% |
| Interquartile 75% (IQ3) | 3.7% | 2.9% |
| Interquartile Range (IQR) | 2.6% | 0.96% |
| Standard Deviation (Sample) | 1.9% | 0.94% |
| Standard Deviation (Population) | 1.9% | 0.94% |
Correlation Details
| Immigrants from Ghana Percentile | Sample Size | Self-Care Disability |
[ 0.0% - 0.5% ] 0.023% | 71,970,441 | 2.5% |
[ 0.0% - 0.5% ] 0.068% | 38,311,589 | 2.4% |
[ 0.0% - 0.5% ] 0.11% | 27,298,275 | 2.4% |
[ 0.0% - 0.5% ] 0.16% | 10,113,869 | 2.3% |
[ 0.0% - 0.5% ] 0.21% | 7,582,639 | 2.4% |
[ 0.0% - 0.5% ] 0.25% | 6,306,766 | 2.5% |
[ 0.0% - 0.5% ] 0.30% | 4,480,801 | 2.2% |
[ 0.0% - 0.5% ] 0.35% | 11,765,219 | 2.8% |
[ 0.0% - 0.5% ] 0.39% | 3,178,062 | 2.1% |
[ 0.0% - 0.5% ] 0.44% | 1,838,127 | 2.3% |
[ 0.0% - 0.5% ] 0.48% | 1,695,359 | 2.3% |
[ 0.5% - 1.0% ] 0.53% | 1,249,764 | 2.1% |
[ 0.5% - 1.0% ] 0.57% | 1,473,350 | 2.3% |
[ 0.5% - 1.0% ] 0.63% | 1,956,850 | 2.4% |
[ 0.5% - 1.0% ] 0.67% | 1,082,324 | 2.8% |
[ 0.5% - 1.0% ] 0.71% | 515,483 | 2.5% |
[ 0.5% - 1.0% ] 0.75% | 737,997 | 2.7% |
[ 0.5% - 1.0% ] 0.81% | 836,796 | 2.4% |
[ 0.5% - 1.0% ] 0.84% | 473,327 | 2.5% |
[ 0.5% - 1.0% ] 0.89% | 680,076 | 2.3% |
[ 0.5% - 1.0% ] 0.94% | 284,203 | 3.3% |
[ 0.5% - 1.0% ] 0.99% | 523,051 | 2.6% |
[ 1.0% - 1.5% ] 1.03% | 336,007 | 2.6% |
[ 1.0% - 1.5% ] 1.08% | 310,675 | 2.3% |
[ 1.0% - 1.5% ] 1.14% | 265,613 | 2.4% |
[ 1.0% - 1.5% ] 1.18% | 140,128 | 1.9% |
[ 1.0% - 1.5% ] 1.23% | 635,076 | 3.0% |
[ 1.0% - 1.5% ] 1.26% | 327,487 | 2.0% |
[ 1.0% - 1.5% ] 1.30% | 150,381 | 2.4% |
[ 1.0% - 1.5% ] 1.36% | 108,025 | 3.2% |
[ 1.0% - 1.5% ] 1.39% | 160,729 | 3.2% |
[ 1.0% - 1.5% ] 1.45% | 163,712 | 3.3% |
[ 1.0% - 1.5% ] 1.50% | 115,072 | 3.6% |
[ 1.5% - 2.0% ] 1.53% | 140,371 | 3.2% |
[ 1.5% - 2.0% ] 1.58% | 335,914 | 2.0% |
[ 1.5% - 2.0% ] 1.63% | 71,012 | 2.7% |
[ 1.5% - 2.0% ] 1.67% | 63,130 | 3.1% |
[ 1.5% - 2.0% ] 1.73% | 55,782 | 1.6% |
[ 1.5% - 2.0% ] 1.77% | 29,115 | 1.8% |
[ 1.5% - 2.0% ] 1.83% | 27,033 | 3.4% |
[ 1.5% - 2.0% ] 1.86% | 240,968 | 2.9% |
[ 1.5% - 2.0% ] 1.91% | 2,770 | 1.4% |
[ 1.5% - 2.0% ] 1.94% | 160,730 | 2.7% |
[ 2.0% - 2.5% ] 2.00% | 14,531 | 2.7% |
[ 2.0% - 2.5% ] 2.04% | 25,568 | 1.5% |
[ 2.0% - 2.5% ] 2.10% | 65,103 | 1.9% |
[ 2.0% - 2.5% ] 2.14% | 97,226 | 4.8% |
[ 2.0% - 2.5% ] 2.16% | 26,157 | 3.9% |
[ 2.0% - 2.5% ] 2.24% | 76,720 | 2.1% |
[ 2.0% - 2.5% ] 2.26% | 108,677 | 2.4% |
[ 2.0% - 2.5% ] 2.37% | 113,017 | 3.7% |
[ 2.0% - 2.5% ] 2.42% | 7,528 | 0.46% |
[ 2.0% - 2.5% ] 2.44% | 16,737 | 2.1% |
[ 2.5% - 3.0% ] 2.56% | 59,318 | 1.3% |
[ 2.5% - 3.0% ] 2.60% | 384 | 2.4% |
[ 2.5% - 3.0% ] 2.68% | 79,183 | 1.3% |
[ 2.5% - 3.0% ] 2.73% | 293 | 4.8% |
[ 2.5% - 3.0% ] 2.83% | 60,046 | 2.0% |
[ 2.5% - 3.0% ] 2.86% | 16,620 | 1.9% |
[ 2.5% - 3.0% ] 2.91% | 17,792 | 2.0% |
[ 2.5% - 3.0% ] 2.97% | 10,192 | 4.4% |
[ 2.5% - 3.0% ] 2.99% | 208,736 | 3.0% |
[ 3.0% - 3.5% ] 3.14% | 700 | 5.4% |
[ 3.0% - 3.5% ] 3.29% | 20,260 | 2.2% |
[ 3.0% - 3.5% ] 3.33% | 7,846 | 2.0% |
[ 3.0% - 3.5% ] 3.36% | 16,680 | 1.0% |
[ 3.0% - 3.5% ] 3.43% | 55,168 | 2.2% |
[ 3.0% - 3.5% ] 3.46% | 1,705 | 1.4% |
[ 3.5% - 4.0% ] 3.51% | 427 | 2.2% |
[ 3.5% - 4.0% ] 3.56% | 36,538 | 4.2% |
[ 3.5% - 4.0% ] 3.59% | 82,246 | 3.9% |
[ 3.5% - 4.0% ] 3.67% | 2,776 | 4.1% |
[ 3.5% - 4.0% ] 3.73% | 6,295 | 0.40% |
[ 3.5% - 4.0% ] 3.80% | 10,798 | 2.8% |
[ 3.5% - 4.0% ] 3.81% | 82,291 | 3.7% |
[ 3.5% - 4.0% ] 3.86% | 3,056 | 2.7% |
[ 3.5% - 4.0% ] 3.91% | 1,894 | 1.0% |
[ 3.5% - 4.0% ] 3.96% | 23,110 | 2.1% |
[ 4.0% - 4.5% ] 4.05% | 3,535 | 1.2% |
[ 4.0% - 4.5% ] 4.22% | 3,202 | 2.9% |
[ 4.0% - 4.5% ] 4.23% | 2,551 | 2.7% |
[ 4.0% - 4.5% ] 4.32% | 4,024 | 1.1% |
[ 4.0% - 4.5% ] 4.38% | 30,819 | 2.7% |
[ 4.5% - 5.0% ] 4.71% | 2,101 | 3.5% |
[ 4.5% - 5.0% ] 4.73% | 72,215 | 1.9% |
[ 4.5% - 5.0% ] 4.84% | 10,316 | 1.3% |
[ 4.5% - 5.0% ] 4.89% | 19,938 | 1.2% |
[ 4.5% - 5.0% ] 4.95% | 1,798 | 4.1% |
[ 6.0% - 6.5% ] 6.14% | 1,010 | 1.6% |
[ 6.5% - 7.0% ] 6.92% | 1,041 | 1.2% |
[ 7.0% - 7.5% ] 7.04% | 22,114 | 1.2% |
[ 7.0% - 7.5% ] 7.22% | 40,724 | 3.0% |
[ 7.0% - 7.5% ] 7.42% | 22,505 | 2.9% |
[ 8.0% - 8.5% ] 8.20% | 2,219 | 1.6% |
[ 8.5% - 9.0% ] 8.62% | 429 | 2.1% |