Immigrants from Ghana Wage/Income Gap
COMPARE
Immigrants from Ghana
Select to Compare
Wage/Income Gap
Immigrants from Ghana Wage/Income Gap
22.3%
WAGE/INCOME GAP
100.0/ 100
METRIC RATING
56th/ 347
METRIC RANK
Immigrants from Ghana Wage/Income Gap Correlation Chart
The statistical analysis conducted on geographies consisting of 199,927,276 people shows a poor positive correlation between the proportion of Immigrants from Ghana and wage/income gap percentage in the United States with a correlation coefficient (R) of 0.171 and weighted average of 22.3%. On average, for every 1% (one percent) increase in Immigrants from Ghana within a typical geography, there is an increase of 0.98% in wage/income gap percentage.
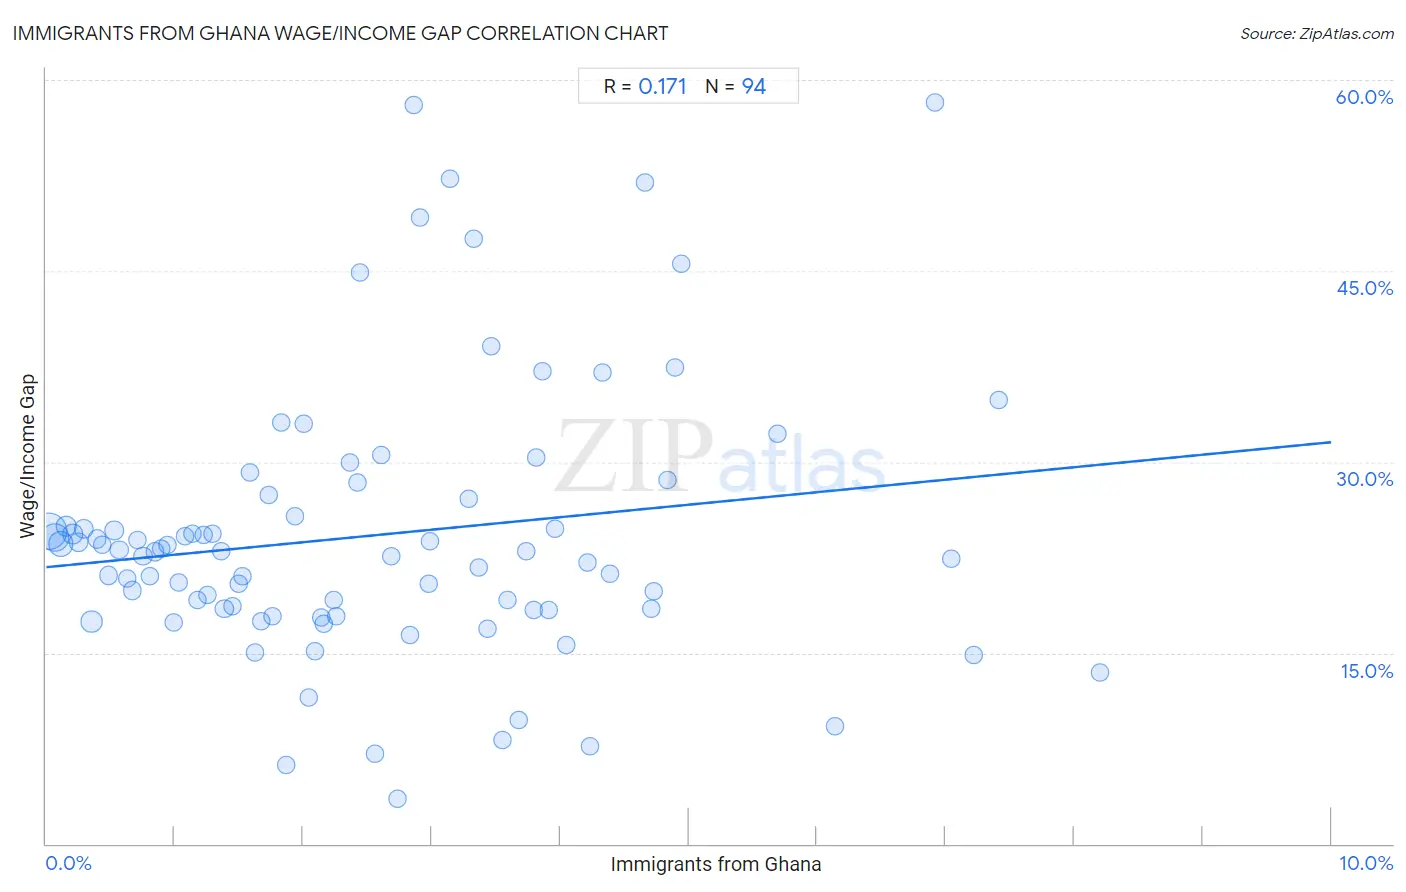
It is essential to understand that the correlation between the percentage of Immigrants from Ghana and wage/income gap percentage does not imply a direct cause-and-effect relationship. It remains uncertain whether the presence of Immigrants from Ghana influences an upward or downward trend in the level of wage/income gap percentage within an area, or if Immigrants from Ghana simply ended up residing in those areas with higher or lower levels of wage/income gap percentage due to other factors.
Demographics Similar to Immigrants from Ghana by Wage/Income Gap
In terms of wage/income gap, the demographic groups most similar to Immigrants from Ghana are Immigrants from Zaire (22.3%, a difference of 0.030%), Ghanaian (22.3%, a difference of 0.10%), Immigrants from Cuba (22.4%, a difference of 0.18%), Navajo (22.4%, a difference of 0.22%), and Immigrants from Middle Africa (22.4%, a difference of 0.24%).
| Demographics | Rating | Rank | Wage/Income Gap |
| Ethiopians | 100.0 /100 | #49 | Exceptional 21.8% |
| Immigrants from Western Africa | 100.0 /100 | #50 | Exceptional 22.0% |
| Tohono O'odham | 100.0 /100 | #51 | Exceptional 22.1% |
| Immigrants from Cameroon | 100.0 /100 | #52 | Exceptional 22.2% |
| Bangladeshis | 100.0 /100 | #53 | Exceptional 22.2% |
| Nepalese | 100.0 /100 | #54 | Exceptional 22.2% |
| Immigrants from Zaire | 100.0 /100 | #55 | Exceptional 22.3% |
| Immigrants from Ghana | 100.0 /100 | #56 | Exceptional 22.3% |
| Ghanaians | 100.0 /100 | #57 | Exceptional 22.3% |
| Immigrants from Cuba | 100.0 /100 | #58 | Exceptional 22.4% |
| Navajo | 100.0 /100 | #59 | Exceptional 22.4% |
| Immigrants from Middle Africa | 100.0 /100 | #60 | Exceptional 22.4% |
| Immigrants from Fiji | 100.0 /100 | #61 | Exceptional 22.4% |
| Immigrants from Guatemala | 100.0 /100 | #62 | Exceptional 22.5% |
| Immigrants from Ecuador | 100.0 /100 | #63 | Exceptional 22.5% |
Immigrants from Ghana Wage/Income Gap Correlation Summary
| Measurement | Immigrants from Ghana Data | Wage/Income Gap Data |
| Minimum | 0.023% | 3.5% |
| Maximum | 8.2% | 58.2% |
| Range | 8.2% | 54.7% |
| Mean | 2.6% | 24.2% |
| Median | 2.2% | 22.9% |
| Interquartile 25% (IQ1) | 1.1% | 18.4% |
| Interquartile 75% (IQ3) | 3.7% | 27.1% |
| Interquartile Range (IQR) | 2.7% | 8.7% |
| Standard Deviation (Sample) | 1.9% | 10.7% |
| Standard Deviation (Population) | 1.9% | 10.6% |
Correlation Details
| Immigrants from Ghana Percentile | Sample Size | Wage/Income Gap |
[ 0.0% - 0.5% ] 0.023% | 71,980,071 | 24.5% |
[ 0.0% - 0.5% ] 0.068% | 38,317,778 | 24.0% |
[ 0.0% - 0.5% ] 0.11% | 27,312,175 | 23.6% |
[ 0.0% - 0.5% ] 0.16% | 10,134,558 | 24.9% |
[ 0.0% - 0.5% ] 0.21% | 7,598,612 | 24.3% |
[ 0.0% - 0.5% ] 0.25% | 6,324,546 | 23.7% |
[ 0.0% - 0.5% ] 0.30% | 4,486,615 | 24.7% |
[ 0.0% - 0.5% ] 0.35% | 11,774,675 | 17.4% |
[ 0.0% - 0.5% ] 0.39% | 3,179,092 | 23.9% |
[ 0.0% - 0.5% ] 0.44% | 1,841,805 | 23.5% |
[ 0.0% - 0.5% ] 0.48% | 1,698,888 | 21.1% |
[ 0.5% - 1.0% ] 0.53% | 1,248,599 | 24.6% |
[ 0.5% - 1.0% ] 0.57% | 1,477,083 | 23.1% |
[ 0.5% - 1.0% ] 0.63% | 1,967,315 | 20.8% |
[ 0.5% - 1.0% ] 0.67% | 1,083,342 | 19.9% |
[ 0.5% - 1.0% ] 0.71% | 514,107 | 23.8% |
[ 0.5% - 1.0% ] 0.75% | 737,997 | 22.6% |
[ 0.5% - 1.0% ] 0.81% | 836,796 | 21.0% |
[ 0.5% - 1.0% ] 0.84% | 478,270 | 22.9% |
[ 0.5% - 1.0% ] 0.89% | 684,734 | 23.2% |
[ 0.5% - 1.0% ] 0.94% | 283,575 | 23.4% |
[ 0.5% - 1.0% ] 0.99% | 523,051 | 17.4% |
[ 1.0% - 1.5% ] 1.03% | 336,007 | 20.5% |
[ 1.0% - 1.5% ] 1.08% | 310,675 | 24.2% |
[ 1.0% - 1.5% ] 1.14% | 270,034 | 24.3% |
[ 1.0% - 1.5% ] 1.18% | 140,128 | 19.1% |
[ 1.0% - 1.5% ] 1.23% | 639,171 | 24.3% |
[ 1.0% - 1.5% ] 1.26% | 327,806 | 19.5% |
[ 1.0% - 1.5% ] 1.30% | 143,937 | 24.4% |
[ 1.0% - 1.5% ] 1.36% | 108,982 | 22.9% |
[ 1.0% - 1.5% ] 1.39% | 160,729 | 18.5% |
[ 1.0% - 1.5% ] 1.45% | 163,712 | 18.6% |
[ 1.0% - 1.5% ] 1.50% | 115,805 | 20.4% |
[ 1.5% - 2.0% ] 1.53% | 140,371 | 21.0% |
[ 1.5% - 2.0% ] 1.58% | 334,906 | 29.2% |
[ 1.5% - 2.0% ] 1.63% | 74,350 | 15.0% |
[ 1.5% - 2.0% ] 1.67% | 63,130 | 17.5% |
[ 1.5% - 2.0% ] 1.73% | 55,782 | 27.4% |
[ 1.5% - 2.0% ] 1.77% | 29,115 | 17.9% |
[ 1.5% - 2.0% ] 1.83% | 27,033 | 33.1% |
[ 1.5% - 2.0% ] 1.86% | 240,968 | 6.2% |
[ 1.5% - 2.0% ] 1.94% | 160,730 | 25.7% |
[ 2.0% - 2.5% ] 2.00% | 14,531 | 33.0% |
[ 2.0% - 2.5% ] 2.04% | 25,568 | 11.5% |
[ 2.0% - 2.5% ] 2.10% | 64,578 | 15.1% |
[ 2.0% - 2.5% ] 2.14% | 97,226 | 17.8% |
[ 2.0% - 2.5% ] 2.16% | 27,496 | 17.3% |
[ 2.0% - 2.5% ] 2.24% | 76,720 | 19.2% |
[ 2.0% - 2.5% ] 2.26% | 108,677 | 17.9% |
[ 2.0% - 2.5% ] 2.37% | 113,017 | 30.0% |
[ 2.0% - 2.5% ] 2.42% | 7,528 | 28.4% |
[ 2.0% - 2.5% ] 2.44% | 16,737 | 44.9% |
[ 2.5% - 3.0% ] 2.56% | 59,318 | 7.1% |
[ 2.5% - 3.0% ] 2.60% | 384 | 30.6% |
[ 2.5% - 3.0% ] 2.68% | 79,183 | 22.5% |
[ 2.5% - 3.0% ] 2.73% | 293 | 3.5% |
[ 2.5% - 3.0% ] 2.83% | 60,046 | 16.4% |
[ 2.5% - 3.0% ] 2.86% | 16,620 | 58.1% |
[ 2.5% - 3.0% ] 2.91% | 17,792 | 49.2% |
[ 2.5% - 3.0% ] 2.97% | 10,192 | 20.5% |
[ 2.5% - 3.0% ] 2.99% | 208,602 | 23.7% |
[ 3.0% - 3.5% ] 3.14% | 700 | 52.3% |
[ 3.0% - 3.5% ] 3.29% | 20,260 | 27.1% |
[ 3.0% - 3.5% ] 3.33% | 7,846 | 47.5% |
[ 3.0% - 3.5% ] 3.36% | 16,680 | 21.7% |
[ 3.0% - 3.5% ] 3.43% | 55,168 | 16.9% |
[ 3.0% - 3.5% ] 3.46% | 1,705 | 39.1% |
[ 3.5% - 4.0% ] 3.56% | 36,538 | 8.2% |
[ 3.5% - 4.0% ] 3.59% | 82,246 | 19.2% |
[ 3.5% - 4.0% ] 3.67% | 2,776 | 9.7% |
[ 3.5% - 4.0% ] 3.73% | 6,295 | 23.0% |
[ 3.5% - 4.0% ] 3.80% | 10,798 | 18.4% |
[ 3.5% - 4.0% ] 3.81% | 82,291 | 30.3% |
[ 3.5% - 4.0% ] 3.86% | 3,056 | 37.1% |
[ 3.5% - 4.0% ] 3.91% | 1,894 | 18.3% |
[ 3.5% - 4.0% ] 3.96% | 23,110 | 24.7% |
[ 4.0% - 4.5% ] 4.05% | 3,535 | 15.6% |
[ 4.0% - 4.5% ] 4.22% | 3,202 | 22.1% |
[ 4.0% - 4.5% ] 4.23% | 2,551 | 7.7% |
[ 4.0% - 4.5% ] 4.32% | 4,024 | 37.0% |
[ 4.0% - 4.5% ] 4.38% | 30,590 | 21.2% |
[ 4.5% - 5.0% ] 4.66% | 365 | 51.9% |
[ 4.5% - 5.0% ] 4.71% | 2,101 | 18.5% |
[ 4.5% - 5.0% ] 4.73% | 72,215 | 19.9% |
[ 4.5% - 5.0% ] 4.84% | 10,316 | 28.6% |
[ 4.5% - 5.0% ] 4.89% | 19,938 | 37.4% |
[ 4.5% - 5.0% ] 4.94% | 4,793 | 45.6% |
[ 5.5% - 6.0% ] 5.69% | 1,107 | 32.2% |
[ 6.0% - 6.5% ] 6.14% | 1,010 | 9.2% |
[ 6.5% - 7.0% ] 6.92% | 1,041 | 58.2% |
[ 7.0% - 7.5% ] 7.04% | 22,114 | 22.4% |
[ 7.0% - 7.5% ] 7.22% | 40,724 | 14.8% |
[ 7.0% - 7.5% ] 7.42% | 22,505 | 34.8% |
[ 8.0% - 8.5% ] 8.20% | 2,219 | 13.4% |