Immigrants from Ghana Married-couple Households
COMPARE
Immigrants from Ghana
Select to Compare
Married-couple Households
Immigrants from Ghana Married-couple Households
41.8%
MARRIED-COUPLE HOUSEHOLDS
0.0/ 100
METRIC RATING
299th/ 347
METRIC RANK
Immigrants from Ghana Married-couple Households Correlation Chart
The statistical analysis conducted on geographies consisting of 199,796,188 people shows no correlation between the proportion of Immigrants from Ghana and percentage of married-couple family households in the United States with a correlation coefficient (R) of 0.019 and weighted average of 41.8%. On average, for every 1% (one percent) increase in Immigrants from Ghana within a typical geography, there is an increase of 0.069% in percentage of married-couple family households.
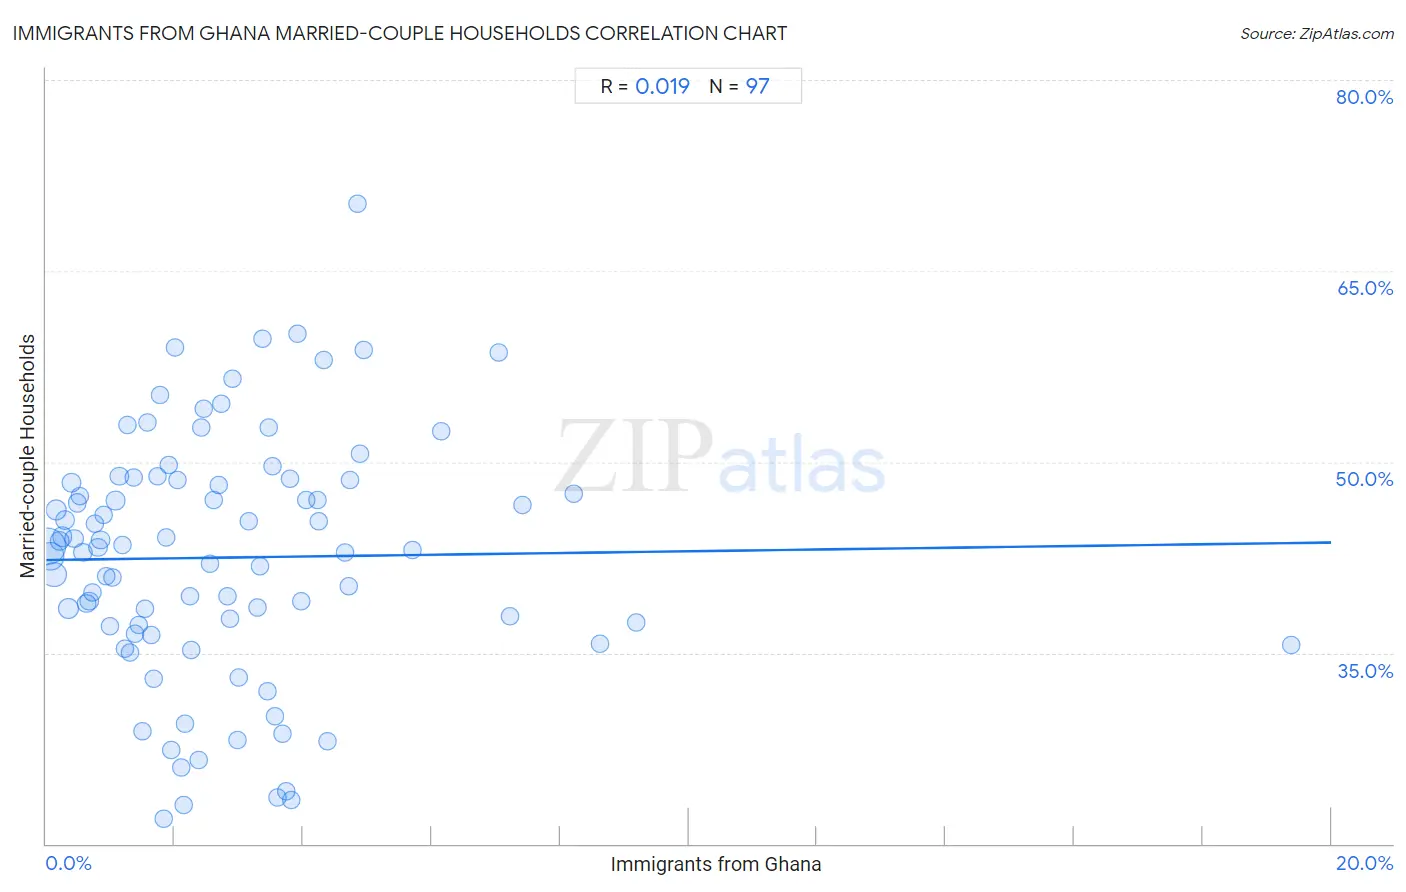
It is essential to understand that the correlation between the percentage of Immigrants from Ghana and percentage of married-couple family households does not imply a direct cause-and-effect relationship. It remains uncertain whether the presence of Immigrants from Ghana influences an upward or downward trend in the level of percentage of married-couple family households within an area, or if Immigrants from Ghana simply ended up residing in those areas with higher or lower levels of percentage of married-couple family households due to other factors.
Demographics Similar to Immigrants from Ghana by Married-couple Households
In terms of married-couple households, the demographic groups most similar to Immigrants from Ghana are Immigrants from Belize (41.8%, a difference of 0.020%), Immigrants from Middle Africa (41.8%, a difference of 0.080%), Arapaho (41.8%, a difference of 0.11%), Immigrants from Bahamas (41.7%, a difference of 0.23%), and Immigrants from Honduras (41.6%, a difference of 0.40%).
| Demographics | Rating | Rank | Married-couple Households |
| Indonesians | 0.0 /100 | #292 | Tragic 42.0% |
| Menominee | 0.0 /100 | #293 | Tragic 42.0% |
| Immigrants from Yemen | 0.0 /100 | #294 | Tragic 42.0% |
| Kiowa | 0.0 /100 | #295 | Tragic 42.0% |
| Immigrants from Sudan | 0.0 /100 | #296 | Tragic 41.9% |
| Arapaho | 0.0 /100 | #297 | Tragic 41.8% |
| Immigrants from Middle Africa | 0.0 /100 | #298 | Tragic 41.8% |
| Immigrants from Ghana | 0.0 /100 | #299 | Tragic 41.8% |
| Immigrants from Belize | 0.0 /100 | #300 | Tragic 41.8% |
| Immigrants from Bahamas | 0.0 /100 | #301 | Tragic 41.7% |
| Immigrants from Honduras | 0.0 /100 | #302 | Tragic 41.6% |
| Sub-Saharan Africans | 0.0 /100 | #303 | Tragic 41.6% |
| Immigrants from Guyana | 0.0 /100 | #304 | Tragic 41.6% |
| Sioux | 0.0 /100 | #305 | Tragic 41.5% |
| Guyanese | 0.0 /100 | #306 | Tragic 41.4% |
Immigrants from Ghana Married-couple Households Correlation Summary
| Measurement | Immigrants from Ghana Data | Married-couple Households Data |
| Minimum | 0.023% | 22.0% |
| Maximum | 19.4% | 70.3% |
| Range | 19.3% | 48.3% |
| Mean | 2.8% | 42.5% |
| Median | 2.2% | 43.2% |
| Interquartile 25% (IQ1) | 1.1% | 36.8% |
| Interquartile 75% (IQ3) | 3.8% | 48.6% |
| Interquartile Range (IQR) | 2.7% | 11.8% |
| Standard Deviation (Sample) | 2.6% | 9.6% |
| Standard Deviation (Population) | 2.6% | 9.6% |
Correlation Details
| Immigrants from Ghana Percentile | Sample Size | Married-couple Households |
[ 0.0% - 0.5% ] 0.023% | 71,970,441 | 43.3% |
[ 0.0% - 0.5% ] 0.068% | 38,303,943 | 42.6% |
[ 0.0% - 0.5% ] 0.11% | 27,296,923 | 41.2% |
[ 0.0% - 0.5% ] 0.16% | 10,113,751 | 46.2% |
[ 0.0% - 0.5% ] 0.21% | 7,585,921 | 43.8% |
[ 0.0% - 0.5% ] 0.25% | 6,315,116 | 44.1% |
[ 0.0% - 0.5% ] 0.30% | 4,477,510 | 45.4% |
[ 0.0% - 0.5% ] 0.35% | 11,762,527 | 38.5% |
[ 0.0% - 0.5% ] 0.39% | 3,178,062 | 48.4% |
[ 0.0% - 0.5% ] 0.44% | 1,834,909 | 44.0% |
[ 0.0% - 0.5% ] 0.48% | 1,695,359 | 46.8% |
[ 0.5% - 1.0% ] 0.53% | 1,249,764 | 47.3% |
[ 0.5% - 1.0% ] 0.57% | 1,473,350 | 42.9% |
[ 0.5% - 1.0% ] 0.63% | 1,958,545 | 38.9% |
[ 0.5% - 1.0% ] 0.67% | 1,085,096 | 39.0% |
[ 0.5% - 1.0% ] 0.71% | 515,483 | 39.7% |
[ 0.5% - 1.0% ] 0.75% | 737,997 | 45.1% |
[ 0.5% - 1.0% ] 0.81% | 832,452 | 43.2% |
[ 0.5% - 1.0% ] 0.84% | 478,270 | 43.9% |
[ 0.5% - 1.0% ] 0.89% | 684,734 | 45.8% |
[ 0.5% - 1.0% ] 0.94% | 284,203 | 41.0% |
[ 0.5% - 1.0% ] 0.99% | 523,051 | 37.1% |
[ 1.0% - 1.5% ] 1.03% | 336,007 | 40.9% |
[ 1.0% - 1.5% ] 1.08% | 310,675 | 47.0% |
[ 1.0% - 1.5% ] 1.14% | 265,613 | 48.8% |
[ 1.0% - 1.5% ] 1.18% | 140,128 | 43.5% |
[ 1.0% - 1.5% ] 1.23% | 639,171 | 35.3% |
[ 1.0% - 1.5% ] 1.26% | 327,487 | 52.9% |
[ 1.0% - 1.5% ] 1.30% | 150,381 | 35.0% |
[ 1.0% - 1.5% ] 1.36% | 109,273 | 48.8% |
[ 1.0% - 1.5% ] 1.39% | 160,729 | 36.5% |
[ 1.0% - 1.5% ] 1.45% | 163,712 | 37.2% |
[ 1.0% - 1.5% ] 1.50% | 115,805 | 28.8% |
[ 1.5% - 2.0% ] 1.53% | 140,371 | 38.4% |
[ 1.5% - 2.0% ] 1.58% | 335,914 | 53.1% |
[ 1.5% - 2.0% ] 1.63% | 71,012 | 36.4% |
[ 1.5% - 2.0% ] 1.67% | 63,130 | 32.9% |
[ 1.5% - 2.0% ] 1.73% | 55,782 | 48.9% |
[ 1.5% - 2.0% ] 1.77% | 29,115 | 55.3% |
[ 1.5% - 2.0% ] 1.83% | 27,033 | 22.0% |
[ 1.5% - 2.0% ] 1.86% | 240,968 | 44.0% |
[ 1.5% - 2.0% ] 1.91% | 2,770 | 49.8% |
[ 1.5% - 2.0% ] 1.94% | 160,730 | 27.4% |
[ 2.0% - 2.5% ] 2.00% | 14,531 | 59.0% |
[ 2.0% - 2.5% ] 2.04% | 25,568 | 48.6% |
[ 2.0% - 2.5% ] 2.10% | 60,793 | 26.0% |
[ 2.0% - 2.5% ] 2.14% | 97,226 | 23.0% |
[ 2.0% - 2.5% ] 2.16% | 26,157 | 29.5% |
[ 2.0% - 2.5% ] 2.24% | 76,720 | 39.5% |
[ 2.0% - 2.5% ] 2.26% | 108,677 | 35.2% |
[ 2.0% - 2.5% ] 2.37% | 113,017 | 26.6% |
[ 2.0% - 2.5% ] 2.42% | 7,528 | 52.7% |
[ 2.0% - 2.5% ] 2.44% | 16,737 | 54.2% |
[ 2.5% - 3.0% ] 2.56% | 59,318 | 42.0% |
[ 2.5% - 3.0% ] 2.60% | 384 | 47.0% |
[ 2.5% - 3.0% ] 2.68% | 79,183 | 48.2% |
[ 2.5% - 3.0% ] 2.73% | 293 | 54.5% |
[ 2.5% - 3.0% ] 2.83% | 60,046 | 39.4% |
[ 2.5% - 3.0% ] 2.86% | 16,620 | 37.7% |
[ 2.5% - 3.0% ] 2.91% | 17,792 | 56.5% |
[ 2.5% - 3.0% ] 2.97% | 10,192 | 28.2% |
[ 2.5% - 3.0% ] 2.99% | 208,736 | 33.1% |
[ 3.0% - 3.5% ] 3.14% | 700 | 45.3% |
[ 3.0% - 3.5% ] 3.29% | 20,260 | 38.6% |
[ 3.0% - 3.5% ] 3.33% | 7,846 | 41.8% |
[ 3.0% - 3.5% ] 3.36% | 16,680 | 59.7% |
[ 3.0% - 3.5% ] 3.43% | 55,168 | 32.0% |
[ 3.0% - 3.5% ] 3.46% | 1,705 | 52.7% |
[ 3.5% - 4.0% ] 3.51% | 427 | 49.7% |
[ 3.5% - 4.0% ] 3.56% | 36,538 | 30.0% |
[ 3.5% - 4.0% ] 3.59% | 82,246 | 23.6% |
[ 3.5% - 4.0% ] 3.67% | 2,776 | 28.6% |
[ 3.5% - 4.0% ] 3.73% | 6,295 | 24.2% |
[ 3.5% - 4.0% ] 3.80% | 10,798 | 48.7% |
[ 3.5% - 4.0% ] 3.81% | 82,291 | 23.4% |
[ 3.5% - 4.0% ] 3.91% | 1,894 | 60.0% |
[ 3.5% - 4.0% ] 3.96% | 23,110 | 39.1% |
[ 4.0% - 4.5% ] 4.05% | 3,535 | 47.0% |
[ 4.0% - 4.5% ] 4.22% | 3,202 | 47.0% |
[ 4.0% - 4.5% ] 4.23% | 2,551 | 45.3% |
[ 4.0% - 4.5% ] 4.32% | 4,024 | 58.0% |
[ 4.0% - 4.5% ] 4.38% | 30,819 | 28.0% |
[ 4.5% - 5.0% ] 4.66% | 365 | 42.9% |
[ 4.5% - 5.0% ] 4.71% | 2,101 | 40.2% |
[ 4.5% - 5.0% ] 4.73% | 72,215 | 48.6% |
[ 4.5% - 5.0% ] 4.84% | 10,316 | 70.3% |
[ 4.5% - 5.0% ] 4.89% | 19,938 | 50.6% |
[ 4.5% - 5.0% ] 4.94% | 4,793 | 58.8% |
[ 5.5% - 6.0% ] 5.69% | 1,107 | 43.1% |
[ 6.0% - 6.5% ] 6.14% | 1,010 | 52.4% |
[ 7.0% - 7.5% ] 7.04% | 22,114 | 58.6% |
[ 7.0% - 7.5% ] 7.22% | 40,724 | 37.9% |
[ 7.0% - 7.5% ] 7.42% | 22,505 | 46.6% |
[ 8.0% - 8.5% ] 8.20% | 2,219 | 47.5% |
[ 8.5% - 9.0% ] 8.62% | 429 | 35.7% |
[ 9.0% - 9.5% ] 9.18% | 534 | 37.4% |
[ 19.0% - 19.5% ] 19.37% | 222 | 35.6% |