Immigrants from Ghana GED/Equivalency
COMPARE
Immigrants from Ghana
Select to Compare
GED/Equivalency
Immigrants from Ghana GED/Equivalency
83.9%
GED/EQUIVALENCY
1.3/ 100
METRIC RATING
244th/ 347
METRIC RANK
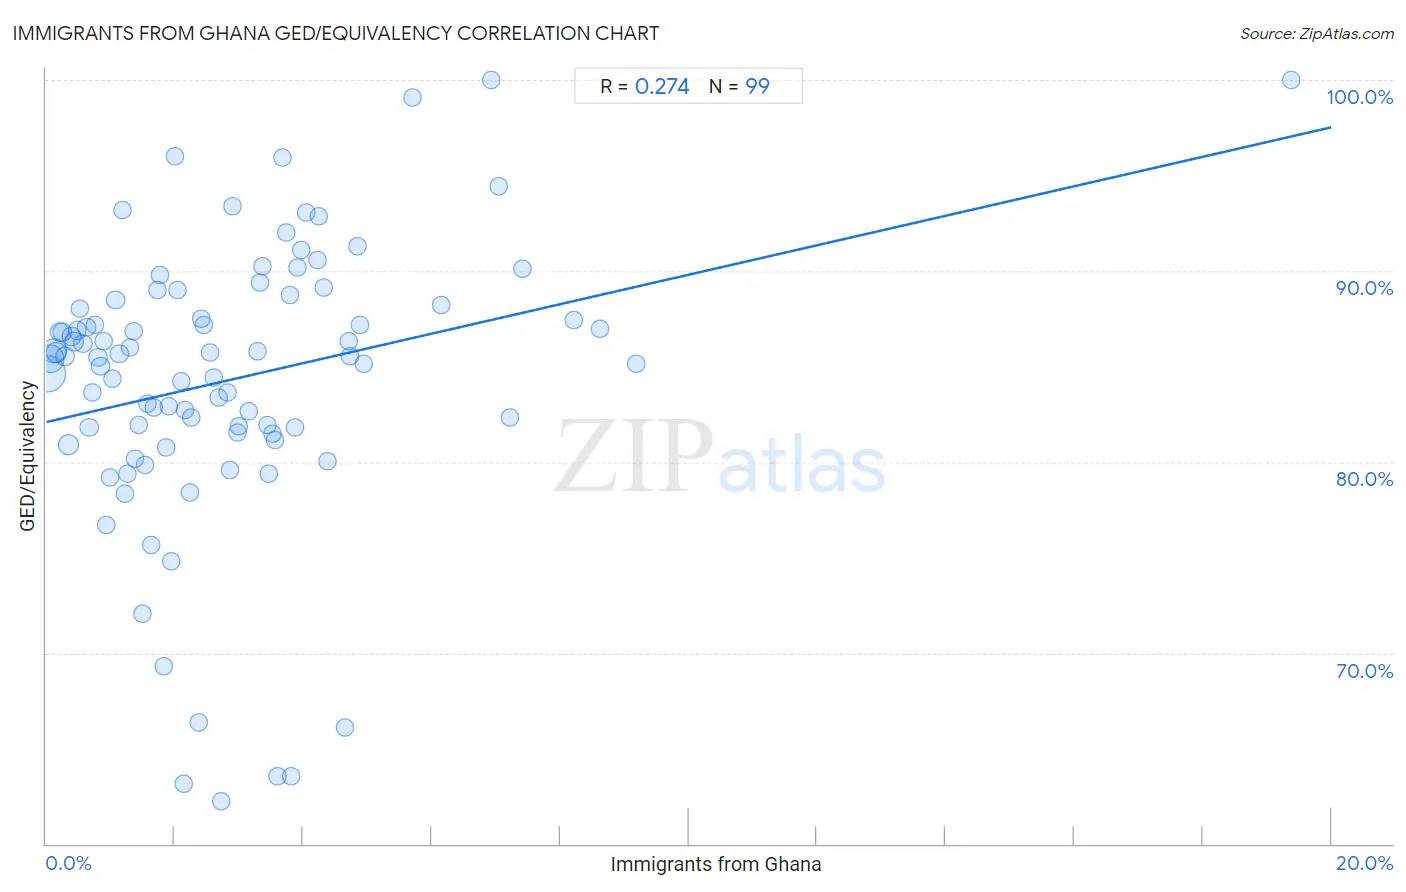
Immigrants from Ghana GED/Equivalency Correlation Chart
The statistical analysis conducted on geographies consisting of 199,951,982 people shows a weak positive correlation between the proportion of Immigrants from Ghana and percentage of population with at least ged/equivalency education in the United States with a correlation coefficient (R) of 0.274 and weighted average of 83.9%. On average, for every 1% (one percent) increase in Immigrants from Ghana within a typical geography, there is an increase of 0.77% in percentage of population with at least ged/equivalency education.
It is essential to understand that the correlation between the percentage of Immigrants from Ghana and percentage of population with at least ged/equivalency education does not imply a direct cause-and-effect relationship. It remains uncertain whether the presence of Immigrants from Ghana influences an upward or downward trend in the level of percentage of population with at least ged/equivalency education within an area, or if Immigrants from Ghana simply ended up residing in those areas with higher or lower levels of percentage of population with at least ged/equivalency education due to other factors.
Demographics Similar to Immigrants from Ghana by GED/Equivalency
In terms of ged/equivalency, the demographic groups most similar to Immigrants from Ghana are Cherokee (83.9%, a difference of 0.010%), Immigrants from Senegal (83.8%, a difference of 0.030%), Chickasaw (83.8%, a difference of 0.050%), Immigrants from Western Africa (83.8%, a difference of 0.090%), and Blackfeet (83.8%, a difference of 0.10%).
| Demographics | Rating | Rank | GED/Equivalency |
| Sub-Saharan Africans | 3.0 /100 | #237 | Tragic 84.2% |
| Immigrants from Peru | 2.7 /100 | #238 | Tragic 84.2% |
| Immigrants from Bahamas | 2.6 /100 | #239 | Tragic 84.2% |
| Immigrants from South Eastern Asia | 2.5 /100 | #240 | Tragic 84.1% |
| Senegalese | 1.9 /100 | #241 | Tragic 84.0% |
| Sri Lankans | 1.9 /100 | #242 | Tragic 84.0% |
| Cherokee | 1.3 /100 | #243 | Tragic 83.9% |
| Immigrants from Ghana | 1.3 /100 | #244 | Tragic 83.9% |
| Immigrants from Senegal | 1.2 /100 | #245 | Tragic 83.8% |
| Chickasaw | 1.2 /100 | #246 | Tragic 83.8% |
| Immigrants from Western Africa | 1.1 /100 | #247 | Tragic 83.8% |
| Blackfeet | 1.1 /100 | #248 | Tragic 83.8% |
| Crow | 1.1 /100 | #249 | Tragic 83.8% |
| Shoshone | 1.0 /100 | #250 | Tragic 83.7% |
| Spanish Americans | 0.8 /100 | #251 | Tragic 83.6% |
Immigrants from Ghana GED/Equivalency Correlation Summary
| Measurement | Immigrants from Ghana Data | GED/Equivalency Data |
| Minimum | 0.023% | 62.2% |
| Maximum | 19.4% | 100.0% |
| Range | 19.3% | 37.8% |
| Mean | 2.9% | 84.3% |
| Median | 2.3% | 85.5% |
| Interquartile 25% (IQ1) | 1.1% | 81.6% |
| Interquartile 75% (IQ3) | 3.8% | 88.2% |
| Interquartile Range (IQR) | 2.7% | 6.7% |
| Standard Deviation (Sample) | 2.6% | 7.4% |
| Standard Deviation (Population) | 2.6% | 7.4% |
Correlation Details
| Immigrants from Ghana Percentile | Sample Size | GED/Equivalency |
[ 0.0% - 0.5% ] 0.023% | 71,980,071 | 84.6% |
[ 0.0% - 0.5% ] 0.068% | 38,320,349 | 85.4% |
[ 0.0% - 0.5% ] 0.11% | 27,312,175 | 85.8% |
[ 0.0% - 0.5% ] 0.16% | 10,134,838 | 85.7% |
[ 0.0% - 0.5% ] 0.21% | 7,596,363 | 86.8% |
[ 0.0% - 0.5% ] 0.25% | 6,324,546 | 86.8% |
[ 0.0% - 0.5% ] 0.30% | 4,487,618 | 85.5% |
[ 0.0% - 0.5% ] 0.35% | 11,774,675 | 80.9% |
[ 0.0% - 0.5% ] 0.39% | 3,181,148 | 86.6% |
[ 0.0% - 0.5% ] 0.44% | 1,843,157 | 86.3% |
[ 0.0% - 0.5% ] 0.48% | 1,698,888 | 86.9% |
[ 0.5% - 1.0% ] 0.53% | 1,249,764 | 88.0% |
[ 0.5% - 1.0% ] 0.57% | 1,481,824 | 86.2% |
[ 0.5% - 1.0% ] 0.63% | 1,967,315 | 87.1% |
[ 0.5% - 1.0% ] 0.67% | 1,085,096 | 81.8% |
[ 0.5% - 1.0% ] 0.71% | 516,201 | 83.6% |
[ 0.5% - 1.0% ] 0.75% | 737,997 | 87.2% |
[ 0.5% - 1.0% ] 0.81% | 832,452 | 85.5% |
[ 0.5% - 1.0% ] 0.84% | 478,270 | 85.0% |
[ 0.5% - 1.0% ] 0.89% | 684,734 | 86.3% |
[ 0.5% - 1.0% ] 0.94% | 284,203 | 76.7% |
[ 0.5% - 1.0% ] 0.99% | 523,051 | 79.2% |
[ 1.0% - 1.5% ] 1.03% | 336,007 | 84.3% |
[ 1.0% - 1.5% ] 1.08% | 310,675 | 88.5% |
[ 1.0% - 1.5% ] 1.14% | 270,034 | 85.6% |
[ 1.0% - 1.5% ] 1.18% | 140,128 | 93.2% |
[ 1.0% - 1.5% ] 1.23% | 639,171 | 78.4% |
[ 1.0% - 1.5% ] 1.26% | 327,806 | 79.4% |
[ 1.0% - 1.5% ] 1.30% | 150,381 | 86.0% |
[ 1.0% - 1.5% ] 1.36% | 109,273 | 86.8% |
[ 1.0% - 1.5% ] 1.39% | 160,729 | 80.2% |
[ 1.0% - 1.5% ] 1.45% | 163,712 | 81.9% |
[ 1.0% - 1.5% ] 1.50% | 115,805 | 72.0% |
[ 1.5% - 2.0% ] 1.53% | 140,371 | 79.9% |
[ 1.5% - 2.0% ] 1.58% | 335,914 | 83.0% |
[ 1.5% - 2.0% ] 1.63% | 74,350 | 75.6% |
[ 1.5% - 2.0% ] 1.67% | 63,130 | 82.8% |
[ 1.5% - 2.0% ] 1.73% | 55,782 | 89.0% |
[ 1.5% - 2.0% ] 1.77% | 29,115 | 89.8% |
[ 1.5% - 2.0% ] 1.83% | 27,033 | 69.3% |
[ 1.5% - 2.0% ] 1.86% | 240,968 | 80.8% |
[ 1.5% - 2.0% ] 1.91% | 2,770 | 82.9% |
[ 1.5% - 2.0% ] 1.94% | 160,730 | 74.8% |
[ 2.0% - 2.5% ] 2.00% | 14,531 | 96.0% |
[ 2.0% - 2.5% ] 2.04% | 25,568 | 89.0% |
[ 2.0% - 2.5% ] 2.10% | 65,103 | 84.2% |
[ 2.0% - 2.5% ] 2.14% | 97,226 | 63.2% |
[ 2.0% - 2.5% ] 2.16% | 27,496 | 82.7% |
[ 2.0% - 2.5% ] 2.24% | 76,720 | 78.4% |
[ 2.0% - 2.5% ] 2.26% | 108,677 | 82.3% |
[ 2.0% - 2.5% ] 2.37% | 113,017 | 66.3% |
[ 2.0% - 2.5% ] 2.42% | 7,528 | 87.5% |
[ 2.0% - 2.5% ] 2.44% | 16,737 | 87.2% |
[ 2.5% - 3.0% ] 2.56% | 59,318 | 85.7% |
[ 2.5% - 3.0% ] 2.60% | 384 | 84.4% |
[ 2.5% - 3.0% ] 2.68% | 79,183 | 83.4% |
[ 2.5% - 3.0% ] 2.73% | 293 | 62.2% |
[ 2.5% - 3.0% ] 2.83% | 60,046 | 83.7% |
[ 2.5% - 3.0% ] 2.86% | 16,620 | 79.6% |
[ 2.5% - 3.0% ] 2.91% | 17,792 | 93.4% |
[ 2.5% - 3.0% ] 2.97% | 10,192 | 81.6% |
[ 2.5% - 3.0% ] 2.99% | 208,736 | 81.9% |
[ 3.0% - 3.5% ] 3.14% | 700 | 82.7% |
[ 3.0% - 3.5% ] 3.29% | 20,260 | 85.8% |
[ 3.0% - 3.5% ] 3.33% | 7,846 | 89.4% |
[ 3.0% - 3.5% ] 3.36% | 16,680 | 90.3% |
[ 3.0% - 3.5% ] 3.43% | 55,168 | 81.9% |
[ 3.0% - 3.5% ] 3.46% | 1,705 | 79.4% |
[ 3.5% - 4.0% ] 3.51% | 427 | 81.5% |
[ 3.5% - 4.0% ] 3.56% | 36,538 | 81.1% |
[ 3.5% - 4.0% ] 3.59% | 82,246 | 63.6% |
[ 3.5% - 4.0% ] 3.67% | 2,776 | 95.9% |
[ 3.5% - 4.0% ] 3.73% | 6,295 | 92.0% |
[ 3.5% - 4.0% ] 3.80% | 10,798 | 88.8% |
[ 3.5% - 4.0% ] 3.81% | 82,291 | 63.5% |
[ 3.5% - 4.0% ] 3.87% | 3,698 | 81.8% |
[ 3.5% - 4.0% ] 3.91% | 1,894 | 90.2% |
[ 3.5% - 4.0% ] 3.96% | 23,110 | 91.1% |
[ 4.0% - 4.5% ] 4.05% | 3,535 | 93.0% |
[ 4.0% - 4.5% ] 4.22% | 3,202 | 90.6% |
[ 4.0% - 4.5% ] 4.23% | 2,551 | 92.9% |
[ 4.0% - 4.5% ] 4.32% | 4,024 | 89.1% |
[ 4.0% - 4.5% ] 4.38% | 30,819 | 80.0% |
[ 4.5% - 5.0% ] 4.66% | 365 | 66.1% |
[ 4.5% - 5.0% ] 4.71% | 2,101 | 86.3% |
[ 4.5% - 5.0% ] 4.73% | 72,215 | 85.5% |
[ 4.5% - 5.0% ] 4.84% | 10,316 | 91.3% |
[ 4.5% - 5.0% ] 4.89% | 19,938 | 87.2% |
[ 4.5% - 5.0% ] 4.94% | 4,793 | 85.2% |
[ 5.5% - 6.0% ] 5.69% | 1,107 | 99.1% |
[ 6.0% - 6.5% ] 6.14% | 1,010 | 88.2% |
[ 6.5% - 7.0% ] 6.92% | 1,041 | 100.0% |
[ 7.0% - 7.5% ] 7.04% | 22,114 | 94.4% |
[ 7.0% - 7.5% ] 7.22% | 40,724 | 82.3% |
[ 7.0% - 7.5% ] 7.42% | 22,505 | 90.1% |
[ 8.0% - 8.5% ] 8.20% | 2,219 | 87.4% |
[ 8.5% - 9.0% ] 8.62% | 429 | 87.0% |
[ 9.0% - 9.5% ] 9.18% | 534 | 85.2% |
[ 19.0% - 19.5% ] 19.37% | 222 | 100.0% |