Immigrants from Eritrea Self-Care Disability
COMPARE
Immigrants from Eritrea
Select to Compare
Self-Care Disability
Immigrants from Eritrea Self-Care Disability
2.2%
SELF-CARE DISABILITY
100.0/ 100
METRIC RATING
19th/ 347
METRIC RANK
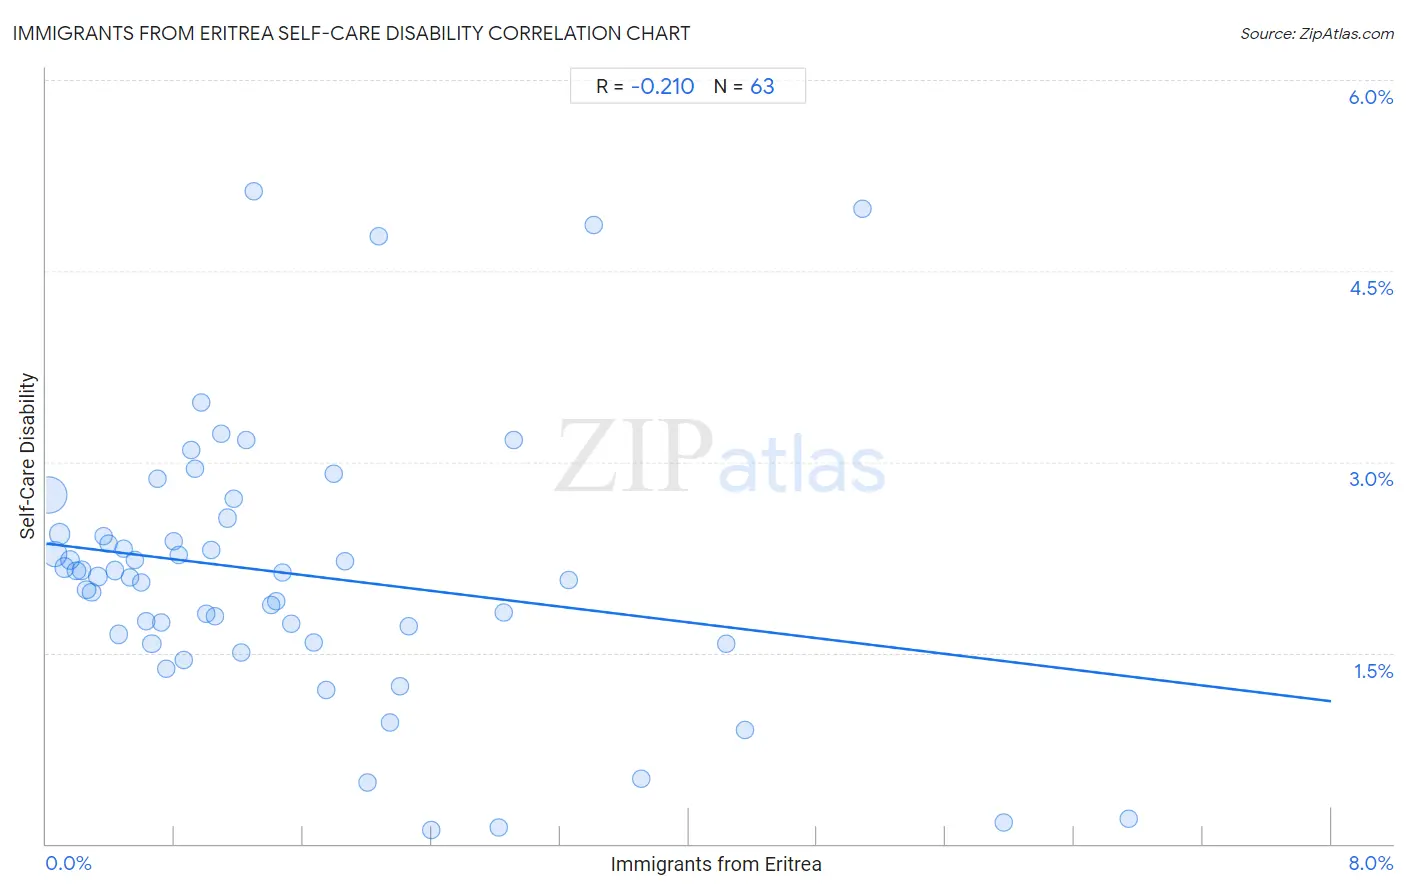
Immigrants from Eritrea Self-Care Disability Correlation Chart
The statistical analysis conducted on geographies consisting of 104,840,277 people shows a weak negative correlation between the proportion of Immigrants from Eritrea and percentage of population with self-care disability in the United States with a correlation coefficient (R) of -0.210 and weighted average of 2.2%. On average, for every 1% (one percent) increase in Immigrants from Eritrea within a typical geography, there is a decrease of 0.15% in percentage of population with self-care disability.
It is essential to understand that the correlation between the percentage of Immigrants from Eritrea and percentage of population with self-care disability does not imply a direct cause-and-effect relationship. It remains uncertain whether the presence of Immigrants from Eritrea influences an upward or downward trend in the level of percentage of population with self-care disability within an area, or if Immigrants from Eritrea simply ended up residing in those areas with higher or lower levels of percentage of population with self-care disability due to other factors.
Demographics Similar to Immigrants from Eritrea by Self-Care Disability
In terms of self-care disability, the demographic groups most similar to Immigrants from Eritrea are Tongan (2.2%, a difference of 0.080%), Immigrants from Taiwan (2.2%, a difference of 0.33%), Bulgarian (2.2%, a difference of 0.33%), Immigrants from Venezuela (2.2%, a difference of 0.36%), and Cambodian (2.2%, a difference of 0.58%).
| Demographics | Rating | Rank | Self-Care Disability |
| Immigrants from Ethiopia | 100.0 /100 | #12 | Exceptional 2.2% |
| Ethiopians | 100.0 /100 | #13 | Exceptional 2.2% |
| Luxembourgers | 100.0 /100 | #14 | Exceptional 2.2% |
| Okinawans | 100.0 /100 | #15 | Exceptional 2.2% |
| Immigrants from Kuwait | 100.0 /100 | #16 | Exceptional 2.2% |
| Immigrants from Saudi Arabia | 100.0 /100 | #17 | Exceptional 2.2% |
| Immigrants from Taiwan | 100.0 /100 | #18 | Exceptional 2.2% |
| Immigrants from Eritrea | 100.0 /100 | #19 | Exceptional 2.2% |
| Tongans | 100.0 /100 | #20 | Exceptional 2.2% |
| Bulgarians | 100.0 /100 | #21 | Exceptional 2.2% |
| Immigrants from Venezuela | 100.0 /100 | #22 | Exceptional 2.2% |
| Cambodians | 100.0 /100 | #23 | Exceptional 2.2% |
| Cypriots | 100.0 /100 | #24 | Exceptional 2.2% |
| Turks | 100.0 /100 | #25 | Exceptional 2.2% |
| Immigrants from Sri Lanka | 99.9 /100 | #26 | Exceptional 2.2% |
Immigrants from Eritrea Self-Care Disability Correlation Summary
| Measurement | Immigrants from Eritrea Data | Self-Care Disability Data |
| Minimum | 0.014% | 0.11% |
| Maximum | 6.7% | 5.1% |
| Range | 6.7% | 5.0% |
| Mean | 1.5% | 2.1% |
| Median | 1.1% | 2.1% |
| Interquartile 25% (IQ1) | 0.52% | 1.6% |
| Interquartile 75% (IQ3) | 2.1% | 2.4% |
| Interquartile Range (IQR) | 1.5% | 0.85% |
| Standard Deviation (Sample) | 1.4% | 1.1% |
| Standard Deviation (Population) | 1.4% | 1.1% |
Correlation Details
| Immigrants from Eritrea Percentile | Sample Size | Self-Care Disability |
[ 0.0% - 0.5% ] 0.014% | 52,579,921 | 2.7% |
[ 0.0% - 0.5% ] 0.051% | 18,891,979 | 2.3% |
[ 0.0% - 0.5% ] 0.082% | 8,972,168 | 2.4% |
[ 0.0% - 0.5% ] 0.11% | 6,721,312 | 2.2% |
[ 0.0% - 0.5% ] 0.15% | 3,451,738 | 2.2% |
[ 0.0% - 0.5% ] 0.19% | 2,239,496 | 2.1% |
[ 0.0% - 0.5% ] 0.22% | 1,655,310 | 2.1% |
[ 0.0% - 0.5% ] 0.25% | 1,583,610 | 2.0% |
[ 0.0% - 0.5% ] 0.28% | 1,479,863 | 2.0% |
[ 0.0% - 0.5% ] 0.32% | 1,495,513 | 2.1% |
[ 0.0% - 0.5% ] 0.36% | 756,904 | 2.4% |
[ 0.0% - 0.5% ] 0.39% | 970,883 | 2.4% |
[ 0.0% - 0.5% ] 0.43% | 545,841 | 2.1% |
[ 0.0% - 0.5% ] 0.45% | 334,699 | 1.6% |
[ 0.0% - 0.5% ] 0.49% | 368,845 | 2.3% |
[ 0.5% - 1.0% ] 0.52% | 184,423 | 2.1% |
[ 0.5% - 1.0% ] 0.55% | 377,815 | 2.2% |
[ 0.5% - 1.0% ] 0.59% | 213,380 | 2.0% |
[ 0.5% - 1.0% ] 0.62% | 192,670 | 1.8% |
[ 0.5% - 1.0% ] 0.66% | 225,083 | 1.6% |
[ 0.5% - 1.0% ] 0.69% | 76,587 | 2.9% |
[ 0.5% - 1.0% ] 0.72% | 33,539 | 1.7% |
[ 0.5% - 1.0% ] 0.74% | 20,975 | 1.4% |
[ 0.5% - 1.0% ] 0.79% | 159,240 | 2.4% |
[ 0.5% - 1.0% ] 0.83% | 163,170 | 2.3% |
[ 0.5% - 1.0% ] 0.85% | 51,722 | 1.4% |
[ 0.5% - 1.0% ] 0.90% | 39,746 | 3.1% |
[ 0.5% - 1.0% ] 0.92% | 101,950 | 2.9% |
[ 0.5% - 1.0% ] 0.96% | 58,673 | 3.5% |
[ 0.5% - 1.0% ] 1.00% | 52,714 | 1.8% |
[ 1.0% - 1.5% ] 1.03% | 65,994 | 2.3% |
[ 1.0% - 1.5% ] 1.05% | 112,860 | 1.8% |
[ 1.0% - 1.5% ] 1.09% | 38,594 | 3.2% |
[ 1.0% - 1.5% ] 1.13% | 95,331 | 2.6% |
[ 1.0% - 1.5% ] 1.17% | 64,577 | 2.7% |
[ 1.0% - 1.5% ] 1.22% | 35,785 | 1.5% |
[ 1.0% - 1.5% ] 1.25% | 30,788 | 3.2% |
[ 1.0% - 1.5% ] 1.29% | 4,017 | 5.1% |
[ 1.0% - 1.5% ] 1.40% | 42,594 | 1.9% |
[ 1.0% - 1.5% ] 1.43% | 69,203 | 1.9% |
[ 1.0% - 1.5% ] 1.47% | 20,996 | 2.1% |
[ 1.5% - 2.0% ] 1.52% | 12,080 | 1.7% |
[ 1.5% - 2.0% ] 1.67% | 8,341 | 1.6% |
[ 1.5% - 2.0% ] 1.74% | 18,228 | 1.2% |
[ 1.5% - 2.0% ] 1.79% | 4,302 | 2.9% |
[ 1.5% - 2.0% ] 1.86% | 1,936 | 2.2% |
[ 2.0% - 2.5% ] 2.00% | 52,360 | 0.48% |
[ 2.0% - 2.5% ] 2.07% | 12,774 | 4.8% |
[ 2.0% - 2.5% ] 2.14% | 2,568 | 0.95% |
[ 2.0% - 2.5% ] 2.20% | 9,952 | 1.2% |
[ 2.0% - 2.5% ] 2.26% | 38,624 | 1.7% |
[ 2.0% - 2.5% ] 2.40% | 1,001 | 0.11% |
[ 2.5% - 3.0% ] 2.82% | 852 | 0.13% |
[ 2.5% - 3.0% ] 2.85% | 37,898 | 1.8% |
[ 2.5% - 3.0% ] 2.91% | 30,259 | 3.2% |
[ 3.0% - 3.5% ] 3.25% | 338 | 2.1% |
[ 3.0% - 3.5% ] 3.41% | 1,850 | 4.9% |
[ 3.5% - 4.0% ] 3.70% | 4,809 | 0.51% |
[ 4.0% - 4.5% ] 4.23% | 14,553 | 1.6% |
[ 4.0% - 4.5% ] 4.35% | 1,425 | 0.89% |
[ 5.0% - 5.5% ] 5.08% | 3,147 | 5.0% |
[ 5.5% - 6.0% ] 5.96% | 587 | 0.17% |
[ 6.5% - 7.0% ] 6.74% | 1,885 | 0.20% |