Immigrants from Eritrea Disability Age Under 5

COMPARE

Immigrants from Eritrea
Race
Ancestry
AfghanAfricanAlaska NativeAlaskan AthabascanAlbanianAleutAlsatianAmericanApacheArabArapahoArgentineanArmenianAssyrian/Chaldean/SyriacAustralianAustrianBahamianBangladeshiBarbadianBasqueBelgianBelizeanBermudanBhutaneseBlackfeetBolivianBrazilianBritishBritish West IndianBulgarianBurmeseCajunCambodianCanadianCape VerdeanCarpatho RusynCelticCentral AmericanCentral American IndianCherokeeCheyenneChickasawChileanChineseChippewaChoctawColombianColvilleComancheCosta RicanCreeCreekCroatianCrowCubanCypriotCzechCzechoslovakianDanishDelawareDominicanDutchDutch West IndianEastern EuropeanEcuadorianEgyptianEnglishEstonianEthiopianEuropeanFijianFilipinoFinnishFrenchFrench American IndianFrench CanadianGermanGerman RussianGhanaianGreekGuamanian/ChamorroGuatemalanGuyaneseHaitianHmongHonduranHopiHoumaHungarianIcelanderIndian (Asian)IndonesianInupiatIranianIraqiIrishIroquoisIsraeliItalianJamaicanJapaneseJordanianKenyanKiowaKoreanLaotianLatvianLebaneseLiberianLithuanianLumbeeLuxembourgerMacedonianMalaysianMalteseMarshalleseMenomineeMexicanMexican American IndianMongolianMoroccanNative HawaiianNavajoNepaleseNew ZealanderNicaraguanNigerianNorthern EuropeanNorwegianOkinawanOsageOttawaPaiutePakistaniPalestinianPanamanianParaguayanPennsylvania GermanPeruvianPimaPolishPortuguesePotawatomiPuebloPuerto RicanPuget Sound SalishRomanianRussianSalvadoranSamoanScandinavianScotch-IrishScottishSeminoleSenegaleseSerbianShoshoneSierra LeoneanSiouxSlavicSlovakSloveneSomaliSouth AfricanSouth AmericanSouth American IndianSoviet UnionSpaniardSpanishSpanish AmericanSpanish American IndianSri LankanSubsaharan AfricanSudaneseSwedishSwissSyrianTaiwaneseThaiTlingit-HaidaTohono O'OdhamTonganTrinidadian and TobagonianTsimshianTurkishU.S. Virgin IslanderUgandanUkrainianUruguayanUteVenezuelanVietnameseWelshWest IndianYakamaYaquiYugoslavianYumanYup'ikZimbabwean
Immigration
NonimmigrantsImmigrantsAfghanistanAfricaAlbaniaArgentinaArmeniaAsiaAustraliaAustriaBahamasBangladeshBarbadosBelarusBelgiumBelizeBoliviaBosnia and HerzegovinaBrazilBulgariaBurma/MyanmarCabo VerdeCambodiaCameroonCanadaCaribbeanCentral AmericaChileChinaColombiaCongoCosta RicaCroatiaCubaCzechoslovakiaDenmarkDominicaDominican RepublicEastern AfricaEastern AsiaEastern EuropeEcuadorEgyptEl SalvadorEnglandEritreaEthiopiaEuropeFijiFranceGermanyGhanaGreeceGrenadaGuatemalaGuyanaHaitiHondurasHong KongHungaryIndiaIndonesiaIranIraqIrelandIsraelItalyJamaicaJapanJordanKazakhstanKenyaKoreaKuwaitLaosLatin AmericaLatviaLebanonLiberiaLithuaniaMalaysiaMexicoMicronesiaMiddle AfricaMoldovaMoroccoNepalNetherlandsNicaraguaNigeriaNorth AmericaNorth MacedoniaNorthern AfricaNorthern EuropeNorwayOceaniaPakistanPanamaPeruPhilippinesPolandPortugalRomaniaRussiaSaudi ArabiaScotlandSenegalSerbiaSierra LeoneSingaporeSomaliaSouth AfricaSouth AmericaSouth Central AsiaSouth Eastern AsiaSouthern EuropeSpainSri LankaSt. Vincent and the GrenadinesSudanSwedenSwitzerlandSyriaTaiwanThailandTrinidad and TobagoTurkeyUgandaUkraineUruguayUzbekistanVenezuelaVietnamWest IndiesWestern AfricaWestern AsiaWestern EuropeYemenZaireZimbabweAzores
Select to Compare
Race
Ancestry
AfghanAfricanAlaska NativeAlaskan AthabascanAlbanianAleutAlsatianAmericanApacheArabArapahoArgentineanArmenianAssyrian/Chaldean/SyriacAustralianAustrianBahamianBangladeshiBarbadianBasqueBelgianBelizeanBermudanBhutaneseBlackfeetBolivianBrazilianBritishBritish West IndianBulgarianBurmeseCajunCambodianCanadianCape VerdeanCarpatho RusynCelticCentral AmericanCentral American IndianCherokeeCheyenneChickasawChileanChineseChippewaChoctawColombianColvilleComancheCosta RicanCreeCreekCroatianCrowCubanCypriotCzechCzechoslovakianDanishDelawareDominicanDutchDutch West IndianEastern EuropeanEcuadorianEgyptianEnglishEstonianEthiopianEuropeanFijianFilipinoFinnishFrenchFrench American IndianFrench CanadianGermanGerman RussianGhanaianGreekGuamanian/ChamorroGuatemalanGuyaneseHaitianHmongHonduranHopiHoumaHungarianIcelanderIndian (Asian)IndonesianInupiatIranianIraqiIrishIroquoisIsraeliItalianJamaicanJapaneseJordanianKenyanKiowaKoreanLaotianLatvianLebaneseLiberianLithuanianLumbeeLuxembourgerMacedonianMalaysianMalteseMarshalleseMenomineeMexicanMexican American IndianMongolianMoroccanNative HawaiianNavajoNepaleseNew ZealanderNicaraguanNigerianNorthern EuropeanNorwegianOkinawanOsageOttawaPaiutePakistaniPalestinianPanamanianParaguayanPennsylvania GermanPeruvianPimaPolishPortuguesePotawatomiPuebloPuerto RicanPuget Sound SalishRomanianRussianSalvadoranSamoanScandinavianScotch-IrishScottishSeminoleSenegaleseSerbianShoshoneSierra LeoneanSiouxSlavicSlovakSloveneSomaliSouth AfricanSouth AmericanSouth American IndianSoviet UnionSpaniardSpanishSpanish AmericanSpanish American IndianSri LankanSubsaharan AfricanSudaneseSwedishSwissSyrianTaiwaneseThaiTlingit-HaidaTohono O'OdhamTonganTrinidadian and TobagonianTsimshianTurkishU.S. Virgin IslanderUgandanUkrainianUruguayanUteVenezuelanVietnameseWelshWest IndianYakamaYaquiYugoslavianYumanYup'ikZimbabwean
Immigration
NonimmigrantsImmigrantsAfghanistanAfricaAlbaniaArgentinaArmeniaAsiaAustraliaAustriaBahamasBangladeshBarbadosBelarusBelgiumBelizeBoliviaBosnia and HerzegovinaBrazilBulgariaBurma/MyanmarCabo VerdeCambodiaCameroonCanadaCaribbeanCentral AmericaChileChinaColombiaCongoCosta RicaCroatiaCubaCzechoslovakiaDenmarkDominicaDominican RepublicEastern AfricaEastern AsiaEastern EuropeEcuadorEgyptEl SalvadorEnglandEthiopiaEuropeFijiFranceGermanyGhanaGreeceGrenadaGuatemalaGuyanaHaitiHondurasHong KongHungaryIndiaIndonesiaIranIraqIrelandIsraelItalyJamaicaJapanJordanKazakhstanKenyaKoreaKuwaitLaosLatin AmericaLatviaLebanonLiberiaLithuaniaMalaysiaMexicoMicronesiaMiddle AfricaMoldovaMoroccoNepalNetherlandsNicaraguaNigeriaNorth AmericaNorth MacedoniaNorthern AfricaNorthern EuropeNorwayOceaniaPakistanPanamaPeruPhilippinesPolandPortugalRomaniaRussiaSaudi ArabiaScotlandSenegalSerbiaSierra LeoneSingaporeSomaliaSouth AfricaSouth AmericaSouth Central AsiaSouth Eastern AsiaSouthern EuropeSpainSri LankaSt. Vincent and the GrenadinesSudanSwedenSwitzerlandSyriaTaiwanThailandTrinidad and TobagoTurkeyUgandaUkraineUruguayUzbekistanVenezuelaVietnamWest IndiesWestern AfricaWestern AsiaWestern EuropeYemenZaireZimbabweAzores
Disability Age Under 5
Income
Poverty
Unemployment
Labor Participation
Family Structure
Vehicle Availability
Education Level
Disability

Immigrants from Eritrea Disability Age Under 5
Exceptional

1.2%
DISABILITY | AGE UNDER 5
92.3/ 100
METRIC RATING
120th/ 347
METRIC RANK

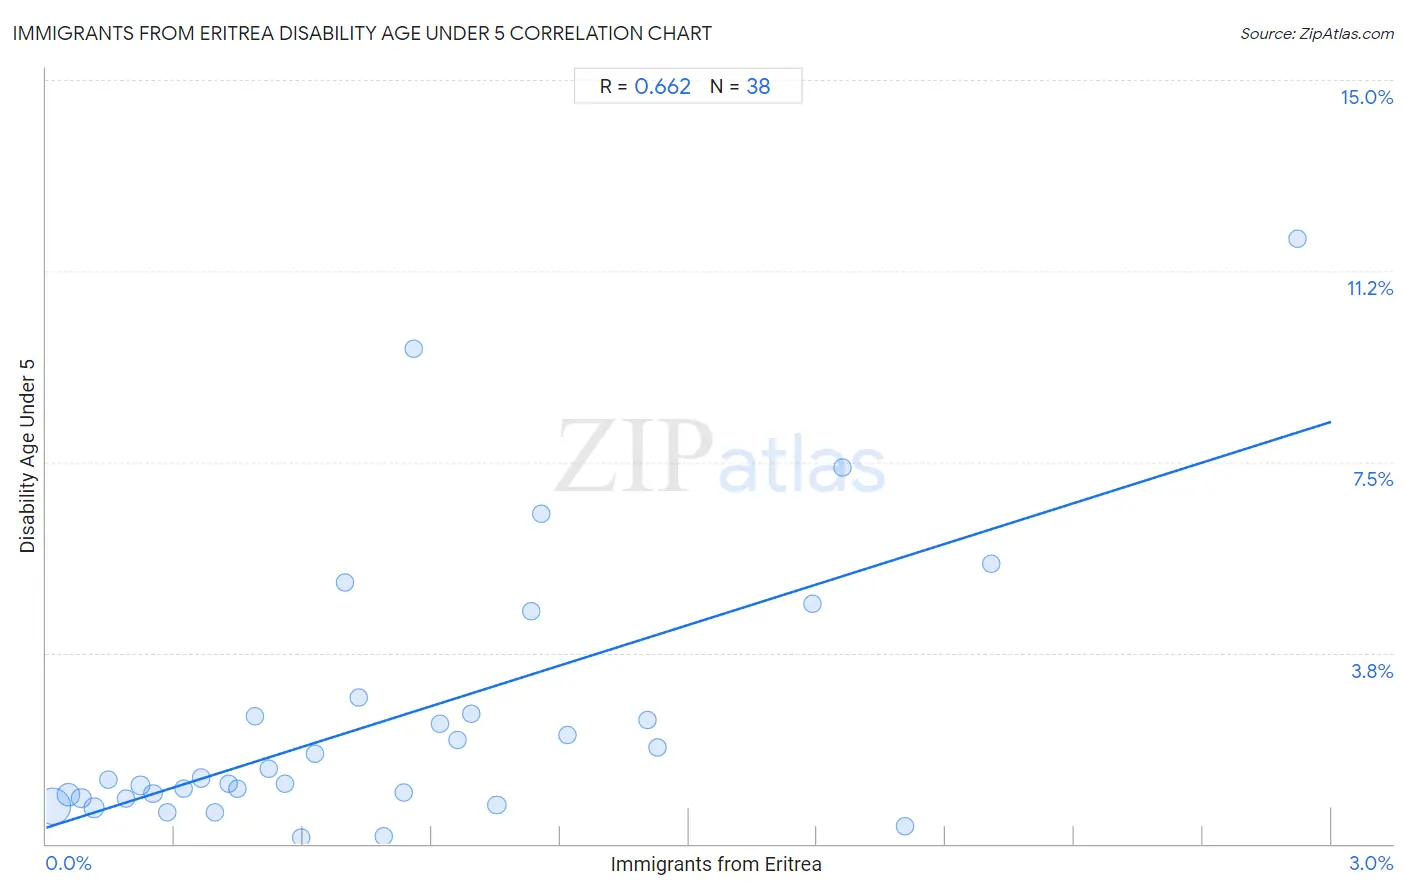
Immigrants from Eritrea Disability Age Under 5 Correlation Chart

The statistical analysis conducted on geographies consisting of 83,045,711 people shows a significant positive correlation between the proportion of Immigrants from Eritrea and percentage of population with a disability under the age of 5 in the United States with a correlation coefficient (R) of 0.662 and weighted average of 1.2%. On average, for every 1% (one percent) increase in Immigrants from Eritrea within a typical geography, there is an increase of 2.7% in percentage of population with a disability under the age of 5.
Immigrants from Eritrea Disability Age Under 5
It is essential to understand that the correlation between the percentage of Immigrants from Eritrea and percentage of population with a disability under the age of 5 does not imply a direct cause-and-effect relationship. It remains uncertain whether the presence of Immigrants from Eritrea influences an upward or downward trend in the level of percentage of population with a disability under the age of 5 within an area, or if Immigrants from Eritrea simply ended up residing in those areas with higher or lower levels of percentage of population with a disability under the age of 5 due to other factors.

Demographics Similar to Immigrants from Eritrea by Disability Age Under 5

In terms of disability age under 5, the demographic groups most similar to Immigrants from Eritrea are Bhutanese (1.2%, a difference of 0.070%), Immigrants from Senegal (1.2%, a difference of 0.28%), Immigrants from Venezuela (1.2%, a difference of 0.41%), Immigrants from Philippines (1.2%, a difference of 0.44%), and Aleut (1.2%, a difference of 0.47%).
DemographicsRating | RankDisability Age Under 5
Immigrants from Oceania
94.2
/100
|
#113
Exceptional
1.2%
Belizeans
93.9
/100
|
#114
Exceptional
1.2%
Immigrants from Caribbean
93.8
/100
|
#115
Exceptional
1.2%
Immigrants from Northern Africa
93.8
/100
|
#116
Exceptional
1.2%
Immigrants from Philippines
93.5
/100
|
#117
Exceptional
1.2%
Immigrants from Venezuela
93.4
/100
|
#118
Exceptional
1.2%
Bhutanese
92.5
/100
|
#119
Exceptional
1.2%
Immigrants from Eritrea
92.3
/100
|
#120
Exceptional
1.2%
Immigrants from Senegal
91.4
/100
|
#121
Exceptional
1.2%
Aleuts
90.7
/100
|
#122
Exceptional
1.2%
Zimbabweans
90.6
/100
|
#123
Exceptional
1.2%
Immigrants from Cambodia
90.5
/100
|
#124
Exceptional
1.2%
Japanese
90.3
/100
|
#125
Exceptional
1.2%
Central Americans
89.7
/100
|
#126
Excellent
1.2%
Immigrants from Romania
88.4
/100
|
#127
Excellent
1.2%

Immigrants from Eritrea Disability Age Under 5 Correlation Summary

MeasurementImmigrants from Eritrea DataDisability Age Under 5 Data
Minimum0.013%0.12%
Maximum2.9%11.9%
Range2.9%11.8%
Mean0.82%2.5%
Median0.66%1.3%
Interquartile 25% (IQ1)0.32%0.90%
Interquartile 75% (IQ3)1.1%2.5%
Interquartile Range (IQR)0.81%1.6%
Standard Deviation (Sample)0.67%2.7%
Standard Deviation (Population)0.66%2.6%

Correlation Details

Immigrants from Eritrea PercentileSample SizeDisability Age Under 5
[
0.0%
-
0.5%
]
0.013%
47,634,6610.73%
[
0.0%
-
0.5%
]
0.052%
14,245,9710.96%
[
0.0%
-
0.5%
]
0.082%
6,351,2050.90%
[
0.0%
-
0.5%
]
0.11%
5,022,7180.71%
[
0.0%
-
0.5%
]
0.14%
1,921,5051.3%
[
0.0%
-
0.5%
]
0.19%
1,156,2120.88%
[
0.0%
-
0.5%
]
0.22%
916,9721.1%
[
0.0%
-
0.5%
]
0.25%
721,5530.98%
[
0.0%
-
0.5%
]
0.28%
1,103,9530.62%
[
0.0%
-
0.5%
]
0.32%
817,3121.1%
[
0.0%
-
0.5%
]
0.36%
518,1641.3%
[
0.0%
-
0.5%
]
0.39%
626,4200.61%
[
0.0%
-
0.5%
]
0.43%
299,0321.2%
[
0.0%
-
0.5%
]
0.45%
242,7151.1%
[
0.0%
-
0.5%
]
0.49%
223,6142.5%
[
0.5%
-
1.0%
]
0.52%
113,0041.5%
[
0.5%
-
1.0%
]
0.56%
226,3791.2%
[
0.5%
-
1.0%
]
0.59%
59,2380.12%
[
0.5%
-
1.0%
]
0.63%
126,0201.8%
[
0.5%
-
1.0%
]
0.70%
46,8675.1%
[
0.5%
-
1.0%
]
0.73%
11,9132.9%
[
0.5%
-
1.0%
]
0.79%
44,7200.15%
[
0.5%
-
1.0%
]
0.83%
82,1561.0%
[
0.5%
-
1.0%
]
0.86%
26,5479.7%
[
0.5%
-
1.0%
]
0.92%
63,4912.4%
[
0.5%
-
1.0%
]
0.96%
58,6732.0%
[
0.5%
-
1.0%
]
0.99%
3,8302.5%
[
1.0%
-
1.5%
]
1.05%
98,1920.75%
[
1.0%
-
1.5%
]
1.13%
50,9214.6%
[
1.0%
-
1.5%
]
1.15%
28,5806.5%
[
1.0%
-
1.5%
]
1.22%
35,7852.1%
[
1.0%
-
1.5%
]
1.40%
42,5942.4%
[
1.0%
-
1.5%
]
1.43%
56,4581.9%
[
1.5%
-
2.0%
]
1.79%
4,3024.7%
[
1.5%
-
2.0%
]
1.86%
1,9367.4%
[
2.0%
-
2.5%
]
2.00%
52,3600.34%
[
2.0%
-
2.5%
]
2.21%
6,0745.5%
[
2.5%
-
3.0%
]
2.92%
3,66411.9%