Immigrants from Eritrea Married-couple Households
COMPARE
Immigrants from Eritrea
Select to Compare
Married-couple Households
Immigrants from Eritrea Married-couple Households
42.1%
MARRIED-COUPLE HOUSEHOLDS
0.0/ 100
METRIC RATING
288th/ 347
METRIC RANK
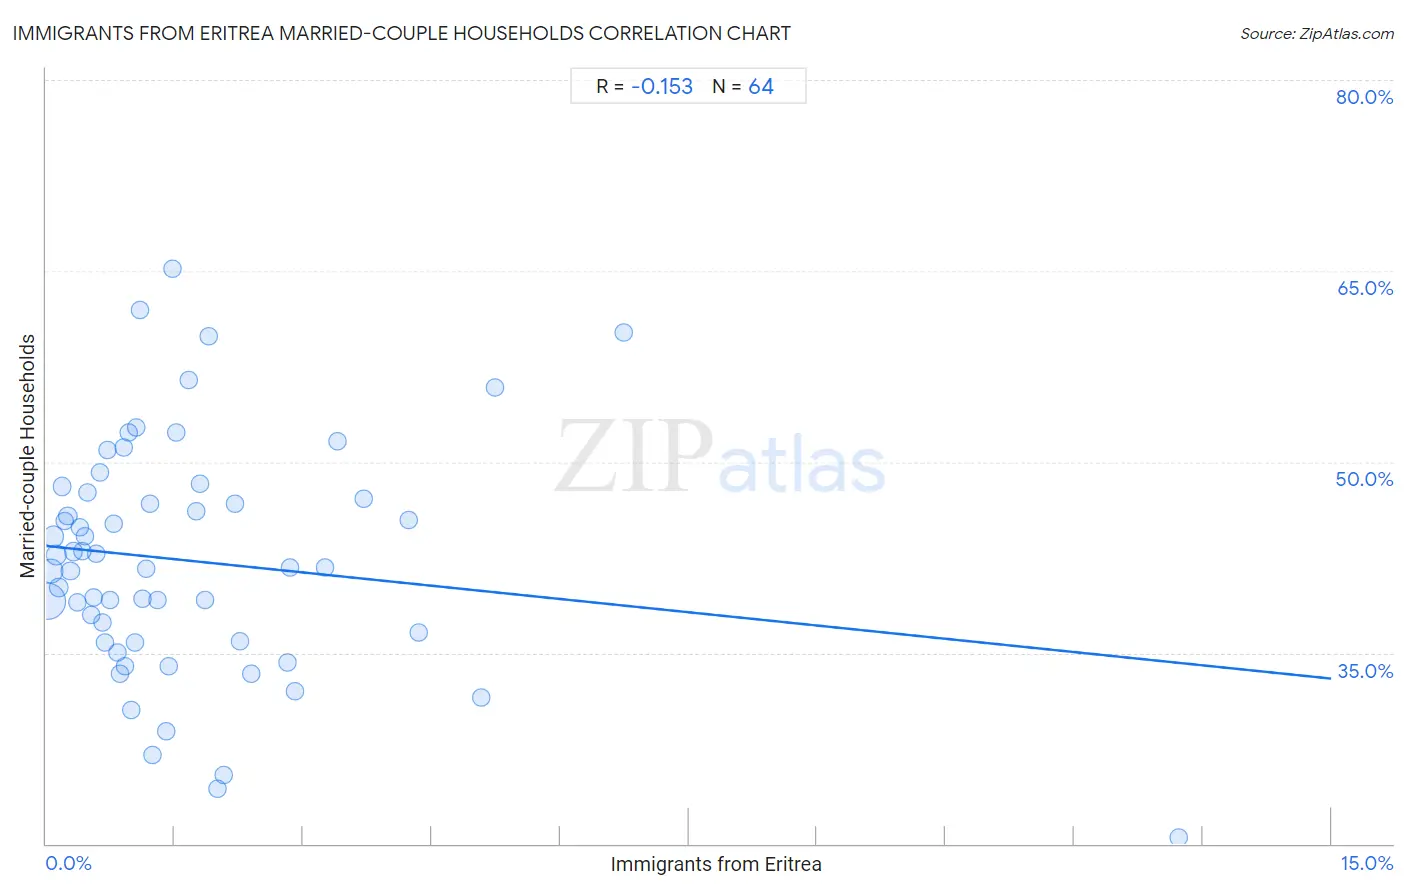
Immigrants from Eritrea Married-couple Households Correlation Chart
The statistical analysis conducted on geographies consisting of 104,844,596 people shows a poor negative correlation between the proportion of Immigrants from Eritrea and percentage of married-couple family households in the United States with a correlation coefficient (R) of -0.153 and weighted average of 42.1%. On average, for every 1% (one percent) increase in Immigrants from Eritrea within a typical geography, there is a decrease of 0.69% in percentage of married-couple family households.
It is essential to understand that the correlation between the percentage of Immigrants from Eritrea and percentage of married-couple family households does not imply a direct cause-and-effect relationship. It remains uncertain whether the presence of Immigrants from Eritrea influences an upward or downward trend in the level of percentage of married-couple family households within an area, or if Immigrants from Eritrea simply ended up residing in those areas with higher or lower levels of percentage of married-couple family households due to other factors.
Demographics Similar to Immigrants from Eritrea by Married-couple Households
In terms of married-couple households, the demographic groups most similar to Immigrants from Eritrea are Sudanese (42.1%, a difference of 0.060%), Chippewa (42.1%, a difference of 0.080%), Honduran (42.1%, a difference of 0.11%), Paiute (42.1%, a difference of 0.11%), and Indonesian (42.0%, a difference of 0.16%).
| Demographics | Rating | Rank | Married-couple Households |
| Immigrants from Guatemala | 0.0 /100 | #281 | Tragic 42.8% |
| Bermudans | 0.0 /100 | #282 | Tragic 42.4% |
| Inupiat | 0.0 /100 | #283 | Tragic 42.4% |
| Cheyenne | 0.0 /100 | #284 | Tragic 42.3% |
| Ghanaians | 0.0 /100 | #285 | Tragic 42.2% |
| Belizeans | 0.0 /100 | #286 | Tragic 42.2% |
| Chippewa | 0.0 /100 | #287 | Tragic 42.1% |
| Immigrants from Eritrea | 0.0 /100 | #288 | Tragic 42.1% |
| Sudanese | 0.0 /100 | #289 | Tragic 42.1% |
| Hondurans | 0.0 /100 | #290 | Tragic 42.1% |
| Paiute | 0.0 /100 | #291 | Tragic 42.1% |
| Indonesians | 0.0 /100 | #292 | Tragic 42.0% |
| Menominee | 0.0 /100 | #293 | Tragic 42.0% |
| Immigrants from Yemen | 0.0 /100 | #294 | Tragic 42.0% |
| Kiowa | 0.0 /100 | #295 | Tragic 42.0% |
Immigrants from Eritrea Married-couple Households Correlation Summary
| Measurement | Immigrants from Eritrea Data | Married-couple Households Data |
| Minimum | 0.014% | 20.5% |
| Maximum | 13.2% | 65.2% |
| Range | 13.2% | 44.8% |
| Mean | 1.7% | 42.2% |
| Median | 1.1% | 41.7% |
| Interquartile 25% (IQ1) | 0.54% | 35.9% |
| Interquartile 75% (IQ3) | 2.0% | 47.4% |
| Interquartile Range (IQR) | 1.5% | 11.5% |
| Standard Deviation (Sample) | 2.0% | 9.2% |
| Standard Deviation (Population) | 2.0% | 9.1% |
Correlation Details
| Immigrants from Eritrea Percentile | Sample Size | Married-couple Households |
[ 0.0% - 0.5% ] 0.014% | 52,579,921 | 39.1% |
[ 0.0% - 0.5% ] 0.051% | 18,896,763 | 41.4% |
[ 0.0% - 0.5% ] 0.082% | 8,972,168 | 44.1% |
[ 0.0% - 0.5% ] 0.11% | 6,721,312 | 42.7% |
[ 0.0% - 0.5% ] 0.15% | 3,451,738 | 40.1% |
[ 0.0% - 0.5% ] 0.19% | 2,239,496 | 48.1% |
[ 0.0% - 0.5% ] 0.22% | 1,655,310 | 45.3% |
[ 0.0% - 0.5% ] 0.25% | 1,583,610 | 45.8% |
[ 0.0% - 0.5% ] 0.28% | 1,479,863 | 41.4% |
[ 0.0% - 0.5% ] 0.32% | 1,495,513 | 43.0% |
[ 0.0% - 0.5% ] 0.36% | 756,904 | 39.0% |
[ 0.0% - 0.5% ] 0.39% | 970,883 | 44.9% |
[ 0.0% - 0.5% ] 0.43% | 545,841 | 43.0% |
[ 0.0% - 0.5% ] 0.45% | 334,699 | 44.2% |
[ 0.0% - 0.5% ] 0.49% | 368,845 | 47.6% |
[ 0.5% - 1.0% ] 0.52% | 184,423 | 37.9% |
[ 0.5% - 1.0% ] 0.55% | 377,815 | 39.4% |
[ 0.5% - 1.0% ] 0.59% | 213,380 | 42.7% |
[ 0.5% - 1.0% ] 0.62% | 192,670 | 49.1% |
[ 0.5% - 1.0% ] 0.66% | 225,083 | 37.4% |
[ 0.5% - 1.0% ] 0.69% | 76,587 | 35.8% |
[ 0.5% - 1.0% ] 0.72% | 33,539 | 50.9% |
[ 0.5% - 1.0% ] 0.74% | 20,975 | 39.2% |
[ 0.5% - 1.0% ] 0.79% | 159,240 | 45.1% |
[ 0.5% - 1.0% ] 0.83% | 163,170 | 35.0% |
[ 0.5% - 1.0% ] 0.85% | 51,722 | 33.3% |
[ 0.5% - 1.0% ] 0.90% | 39,746 | 51.1% |
[ 0.5% - 1.0% ] 0.92% | 101,950 | 34.0% |
[ 0.5% - 1.0% ] 0.96% | 58,673 | 52.3% |
[ 0.5% - 1.0% ] 1.00% | 52,714 | 30.5% |
[ 1.0% - 1.5% ] 1.03% | 65,994 | 35.8% |
[ 1.0% - 1.5% ] 1.05% | 112,860 | 52.7% |
[ 1.0% - 1.5% ] 1.09% | 38,594 | 61.9% |
[ 1.0% - 1.5% ] 1.13% | 95,331 | 39.2% |
[ 1.0% - 1.5% ] 1.17% | 64,577 | 41.6% |
[ 1.0% - 1.5% ] 1.22% | 35,785 | 46.7% |
[ 1.0% - 1.5% ] 1.25% | 30,788 | 27.0% |
[ 1.0% - 1.5% ] 1.29% | 4,017 | 39.2% |
[ 1.0% - 1.5% ] 1.40% | 42,594 | 28.8% |
[ 1.0% - 1.5% ] 1.43% | 69,203 | 34.0% |
[ 1.0% - 1.5% ] 1.47% | 20,996 | 65.2% |
[ 1.5% - 2.0% ] 1.52% | 12,080 | 52.3% |
[ 1.5% - 2.0% ] 1.67% | 8,341 | 56.5% |
[ 1.5% - 2.0% ] 1.74% | 18,228 | 46.2% |
[ 1.5% - 2.0% ] 1.79% | 4,302 | 48.3% |
[ 1.5% - 2.0% ] 1.86% | 1,936 | 39.1% |
[ 1.5% - 2.0% ] 1.89% | 2,378 | 59.8% |
[ 2.0% - 2.5% ] 2.00% | 52,360 | 24.3% |
[ 2.0% - 2.5% ] 2.07% | 12,774 | 25.4% |
[ 2.0% - 2.5% ] 2.20% | 9,952 | 46.7% |
[ 2.0% - 2.5% ] 2.26% | 38,624 | 35.9% |
[ 2.0% - 2.5% ] 2.40% | 1,001 | 33.4% |
[ 2.5% - 3.0% ] 2.82% | 852 | 34.3% |
[ 2.5% - 3.0% ] 2.85% | 37,898 | 41.7% |
[ 2.5% - 3.0% ] 2.91% | 30,259 | 32.0% |
[ 3.0% - 3.5% ] 3.25% | 338 | 41.7% |
[ 3.0% - 3.5% ] 3.41% | 1,850 | 51.7% |
[ 3.5% - 4.0% ] 3.70% | 4,809 | 47.1% |
[ 4.0% - 4.5% ] 4.23% | 14,553 | 45.5% |
[ 4.0% - 4.5% ] 4.35% | 1,425 | 36.6% |
[ 5.0% - 5.5% ] 5.08% | 3,147 | 31.5% |
[ 5.0% - 5.5% ] 5.24% | 191 | 55.8% |
[ 6.5% - 7.0% ] 6.74% | 1,885 | 60.2% |
[ 13.0% - 13.5% ] 13.22% | 121 | 20.5% |